Friday, December 27, 2019

How to Write a Tenure Letter

Why should graduate students and assistant professors get all of the attention? This post is for the associate professors out there being asked to write external tenure letters for the first time. 

David Boonin is a philosopher who has served as department head and associate dean at the University of Colorado, Boulder. He has written us a handy guide to writing these letters. Read it carefully before writing your letter. 

My favorite piece of advice here (besides, what to write): 

"...if you do not think that the candidate merits tenure, it is best that you come out and say so directly. But if for whatever reason you find yourself unwilling to do so, the second best option is not to say that you recommend tenure while at the same time trying to raise enough doubts to secretly signal your true intentions. Rather, it is to conclude by simply declining to make a specific recommendation. Something along the following lines will likely suffice: “There are clearly some significant positives in this case but also some significant negatives. I have tried to detail them and weigh them against each other here but, in the end, I find that the case is simply too close to call. If the candidate is sufficiently strong in teaching and service, then granting them tenure and promotion may well make sense all things considered. But depending on how the remainder of the evidence in the file is viewed, it may also be that the most justified decision is to decline to offer this candidate tenure and promotion.” This will most likely be treated as a negative letter on the whole even if it does not explicitly come out and recommend against tenure and promotion.

To be clear: I do not recommend this as a best practice. If you think the candidate does not merit tenure, it is best to simply say so. But given the reality that some people will be unwilling to simply say so, this is probably the best alternative."
Job Talk Time (The Real Job Talks, Not Practice)

I believe I've blogged about this before, but it can't hurt to point to these slides on academic public speaking once more.

My favorite piece of advice:

Nobody else knows what you wanted to get done but couldn’t. That information is not in their minds. Do not put it there.


And certainly do not put it there before you even say what you were able to do. It is definitely OK (actually, it is important) to anticipate people's questions and answer honestly that you may have wanted to do what they suggest but couldn't because XYZ. I also think it is fine to say that you had thought of that and that it is on your to do list. But first make sure your audience understands what you actually did do. 

Sunday, December 8, 2019

“Conclusions should be short and sweet.”

Read more general advice on how to write well here

Also, for those of you writing third year papers and job market paper: DO NOT WAIT UNTIL THE LAST MINUTE TO START WRITING UP RESULTS. It's OK that you didn't have time to make that last table. It's not OK if your introduction makes it impossible to figure out your contribution to the literature. 

Saturday, November 30, 2019

Paul Niehaus on Doing Research

Here it is. Paul Niehaus reflects on how to do research. Regular readers of my blog know that when I find good advice online, I not only share it but I emphasize my favorite things. This was really hard for this particular article. I think everything he writes is so important! My big advice is to read the article often! Bookmark it. Read it at least once a year, more when you're just starting out. 

How to come up with a research topic?  "At the end of the day, I think most good research ideas involve finding connections between these things — (1) identifying a research opportunity to (2) demonstrate something about reality that advances the (3) conversation in your field."  

The quote is from the article, but I added the numbers and will also add more thoughts. The key insight is that to come up with something new, you have to not only know the latest research in your field, but you also have to have some knowledge of the real world (either by reading the news or by paying attention to things going on in your life) and you have to know about the empirical tricks, data sets, etc. to work with. Yes, this means you're often just collecting this information and not using it. Yes, I know you're too busy writing your job market paper to think about your next paper. Yes, I know you have at least three different coauthors waiting for you to do that thing you promised to do. How can you think about next projects? Answer: It seems to me that a good researcher is always collecting and storing tricks so that they're prepared--great ideas don't necessarily come exactly when you have time to implement them. 

But Paul doesn't stop at how to come up with research topics. He also tells us how to get papers actually written. I really love the advice to fail fast. I struggle with this. It's so hard to give up on paper ideas. Maybe this is why it's especially important for people like me to have lots of ideas.  

But my favorite piece of advice: Sleep well. 

Image result for sleep, ideas, cartoon

Now, bookmark the article. Write a note in your calendar to read it again next year. And again the year after that. 

Friday, November 15, 2019

How to Publish in ReStat

Here is an excellent interview with Amitabh Chandra about his experiences as editor of the Review of Economics and Statistics

To the UConn third year paper writers and students going on the market this year, this message is especially for you: 

What surprised you the most about being an editor of a major general interest economics journal?
I never thought that the single best predictor of getting a paper accepted, would be clear and accessible writing, including an explanation of where the paper breaks down, instead of putting the onus of this discovery on the reader.

It’s my sense that a paper where the reviewer has to figure out what the author did, will not get accepted. Reviewers are happy to suggest improvements, provided they understand what is happening and that makes them appreciate clear writing and explaining. They become grumpy and unreasonable when they believe that the author is making them work extra to understand a paper and most aren’t willing to help such an author. They may not say all this in their review, but they do share these frustrations in the letter to the editor. This is one reason that I encouraged a move towards 60-70% desk-rejections at RESTAT—if an editor can spot obvious problems with clarity or identification within 15 minutes, then why send it out for review?

Of course, all of this results in the unfortunate view that “this accepted paper is so simple, but my substantially more complicated paper is much better,” when the reality is that simplicity and clarity are heavily rewarded. We don’t teach good writing in economics—and routinely confuse LaTeX equations with good writing—but as my little rant highlights, we actually value better-writing. So this is something to work on.

And a related point: 

Is the revise and resubmit process working well for you? If so, what is making it work so well? If not, how could it be improved?

At the Review of Economics and Statistics, we moved to more of a “conditional contract” approach with R&R decisions. In other words, if we gave you an R&R decision, we were basically saying, “do these things and we’ll take the paper.” This preserves everyone’s time, and speeds up the review process but it does come at a cost: we give up the option to publish papers that may improve as a result of the first-round comments, but where we (editors) thought that author’s setting or data did not permit this improvement. This is where subjectivity creeps in: an author who wrote a confusing paper may not be viewed as being up to the task of simplifying it. Was the initial submission confusing because of not being taught how to write well, or is this just a muddled approach? Here’s where an editor’s knowledge of an author can come in. But this is also highly subjective and privileges networks.

I think this last bit is so important. Whether the editor believes you up to the task of successfully revising your paper is subjective. This implies that he/she will use imperfect signals of your ability when making decisions. Of course, clarity of writing is one signal, but I would also add that if your tables are messy, you have typos throughout, you didn't carefully explain your data selection criteria, etc., then all of these may also be used as signals of your general sloppiness with your paper analysis. Another potential issue. If the editor has seen you present papers at conferences or make excellent comments at these conferences, this may also (at least subconsciously) be used as a signal of the likelihood that you are able to complete a tough request for revision. 

Thank you, David Slusky, for your great journalism!  

Sunday, November 10, 2019

Testing for Heterogeneous Impacts?

I've seen it many times before. After showing your baseline results, the thing to do in applied micro research is to split your sample--based on education, gender, age, etc.--to see if impacts vary across different populations. But let's say the estimated coefficients are about the same in the two samples, but one estimate is statistically different from zero while the other isn't. What to do then? Here's what not to do: Claim they are different, that there's an impact in one population but none in the other!!! Ok, so that's a typical mistake but nothing new. 

What I didn't know (but that seems so obvious after reading this twitter thread)? Finding one statistically significant impact in one population but not in another, even when effects are constant, is especially likely when effects are moderate, not too big and not too small. Check out the cool simulation of this here.  

Sunday, November 3, 2019

How to Make a Specification Chart

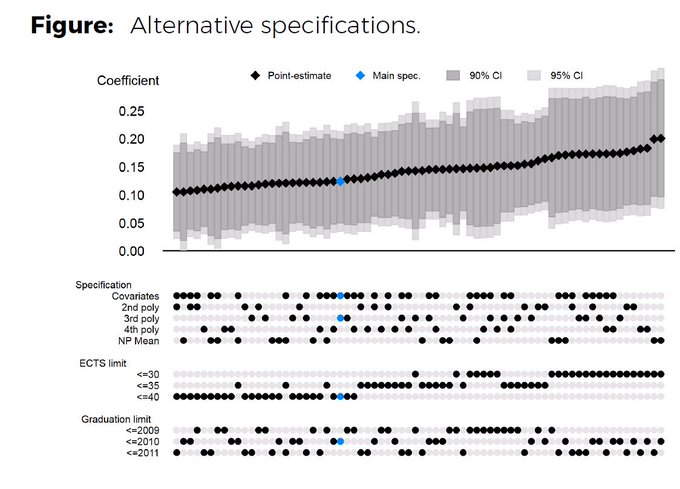
There are so many little decisions we have to make when doing applied micro search. How should we measure our variables of interest? Which sample should be our baseline sample? Which variables should we control for--beyond the obviously important ones? The answer (hopefully) to many of these questions is "it probably doesn't matter so much". If that's the case, then ideally, we'd show our readers that it really doesn't matter. This is great in theory but if there are that many mini-decisions to make, how can we show all of this in 30 page paper? Hans Sievertsen (@hhsievertsen) recently gave us the answer in a tweet. The graph looks amazing. So much information! And he even provides the code he used to make the beautiful picture. 

Image

Friday, October 25, 2019

It's Practice Job Talk Season: How to Prepare for Criticism

I just saw this on twitter:

"The best way to prepare for criticism is to write down what you expect to hear.
Negative feedback stings less when you see it coming.
The comments you didn't anticipate are an opportunity to learn about your blind spots."

--Adam Grant #WednesdayWisdom

You will probably never be able to produce a paper that is criticism-proof. If you keep waiting to think of a criticism-proof idea, you probably will never write anything. That said, keep in mind that it is your responsibility to know the pitfalls of your paper and to be prepared to answer questions about those concerns. If those exact concerns come up during your seminar, then congratulate yourself--your audience understands what you're doing! And is not asleep! If other things come up, then you know you have other problems to worry about, too. It's a good thing you still have time to improve before your actual job talks or you send the paper out to a journal. 

Sunday, October 20, 2019

And When Should You Just Give Up on a Paper?

Yes, I love writing inspirational posts about getting back on the saddle after a journal rejection, never giving up, work hard to make the paper better, etc. Even the thought of giving up on a paper hurts my heart. We work so hard on all of our papers--we watch them grown from just an idea, to a few tables, to an actual completed paper. How can we give up on any of them? They're all our babies! 

Conclusion: don't give up on them. But it's fine to let them rest for a while. While you work on other things. It may be that the time away can clear your head. You may come up with a better way to motivate the analysis or a nice empirical method to address identification issues. When you get back to it, you may just be more excited to work on the project. 

Academic Sequitur has a really nice blog entry to help you decide whether it's time to store a paper in the filing cabinet for a while. What I like best about the advice is the emphasis on point that you should only put a paper in the filing cabinet if you have more promising papers to work on in the meantime. I also like the part at the end that all papers get annoying after a while (especially after a few rejections)---you can't afford to give up on all of them. 

I would add one small note: be mindful of your coauthors. They have worked on the paper quite a bit a bit, too. Even if it may make sense for you to work on other projects, it may not be fair to them. 

Friday, October 11, 2019

Job Market Season: Jobs in Industry

I just saw this very interesting perspective on the difference between academic and industry jobs on twitter (see @xanvong). I had never thought of "battling procrastination" as an important aspect of my job, but now that I think about it, the struggle is real! In fact, now that I think about it, a related struggle is worrying about which projects to work on, should I respond to a coauthor or should write a new problem set today, etc. Maybe I should write a blog entry instead. ;)  

Also, the pay is different. People don't like to talk about that but it does have an impact on people's lives. 

Wednesday, October 9, 2019

Job Market Season: Liberal Arts Colleges

One thing I've learned about the job market for PhD economists: There are many different types of really cool, satisfying different jobs out there! They are different, for sure, but each with their special advantages and disadvantages. I'd say that it's all about finding the perfect match, but actually, I can imagine I'd match well with many different types of jobs. Maybe you would, too. 

See this blog entry about doing development economics at a small liberal arts college. 

Main takeaways in my view: 
  1. There is a lot heterogeneity among liberal arts colleges---try to get to know the specifics about the different departments you're considering. 
  2. They care about teaching. Teaching loads may or may not differ from research universities, but quality teaching is emphasized. If you hate teaching, this probably isn't for you.

Friday, September 27, 2019

Another PSA: Always Check Your Code

..better yet, have someone else check your code? Better yet, build checks into your code to help you catch mistakes. 

So someone made a mistake. Instead of controlling for country of origin fixed effects, the person "controlled for" country of origin by including the country code as a continuous variable. Ouch! I cringed when read this because I have actually seen this mistake being made. It's an easy mistake to make: instead of typing in "i.country" into Stata, you just type "country". I feel for the paper's authors. 

But one thing to catch a typo in the early stages of research (especially for graduate students who are just learning to code), but quite another for this to be caught after a study has been given significant media attention. The paper was about whether religiosity promotes generosity. See the description here

And now my plea to journals: Please require code to be made available for all published papers. This is not only a way for mistakes to be caught quickly, but it provides stronger incentives for paper authors to write better, nicely organized code. 

But now a question: What about working papers? Papers often get significant media attention even before they're published in a journal. Requiring code for publication doesn't help if all of the coverage happens before publication. You may that journalists shouldn't write about working papers, but I'm not sure journalists should necessarily wait until publication given how long it takes for a paper to get through the referee process. 

So maybe another plea to the journals: speed up the referee process. I'd be happy to be given less time to write my referee reports in exchange for prompter reports on my own submissions.

Stata Tip: How to Make a GIF of a Graph

Unfortunately, we can't make put moving pictures in manuscripts, but they are excellent to use in seminars and tweet storms of your papers. Job market candidates, take note! For how to make these in Stata, see here. (h/t David Mckenzie)

Wednesday, September 25, 2019

PSA: Always Read the Codebook

As you may know, I have been doing immigration research for many years, mostly using Census/ACS data. Sometimes I select the immigrant sample based solely on country of birth but sometimes I drop from the sample those born abroad to American parents or those born in U.S. territories. It turns out, however, that if we want to use (1) 1980 Census data and (2) the years in the U.S. variable, we really need to drop those born abroad of American parents. Why? Because in 1980, the year of immigration variable is only available for "foreign-born persons who were not citizens at birth. See the relevant section of the codebook

Conclusion for those doing immigration research using 1980 U.S. Census IPUMS data: Use the citizen variable to select the immigrant sample if you want to control for years in the United States (or year of migration). 

Conclusion for everyone else: Read the codebook carefully! 

Saturday, September 21, 2019

Stata Tips: Two way clustering and tabulating with labels

Two Stata tips for you today:


  1. When you're doing two-way clustering with the reghdfe command (one of my very favorite Stata discoveries!), order matters...at least when you feel the need, the need for speed. :) Cluster first on the variable with more unique values. See comments in this twitter thread
  2. And David McKenzie tells us that this is what we should do right now: Open up Stata and type "ssc install fre".  With the 'fre' package, you can look at the values and their labels when tabulating data. No more "tabulate x" followed by "tabulate x, nolabel".  Get all of the information you need in one easy step! 

  1. Example output of Stata's fre command

Saturday, August 31, 2019

How Not to be Reviewer #2

Here is an old blog post on how not to be Reviewer #2---ie, how not to be mean, unhelpful, vague, aggressive, did I already say mean? This Ashley Brown is pretty hilarious! I'd actually read the blog just for the super funny memes. 

Favorite piece of advice: make sure you're in the right frame of mind before you sit down to review. Maybe perhaps, don't sit down to write one of these just after you've gotten a journal rejection (especially if you received a terrible review). Or if you do need to write that review when you're in a terrible angry mood--because the deadline is approaching (or has come and gone)--be sure to write the review you would like to receive! 

Wednesday, August 28, 2019

Fun with Fixed Effects: Selection into Identification

It's funny how it happens. Last week I was talking with a coauthor about heterogeneous impacts and how this makes interpretation of results difficult even in perfectly identified models. And then this week, there's a brand new NBER paper discussing this very issue! Thank you, NBER (and Douglas L. Miller, Na’ama Shenhav, Michel Z. Grosz--the paper's authors) for delivering this careful analysis exactly when I was thinking about this stuff. 

Na'ama explains everything so nicely in this twitter thread. The basic idea: Imagine you have a family fixed effects model (same family, but some children exposed to a policy and others not exposed because of when they happened to be born). It's a nice natural experiment and would give you the right average treatment effect if everyone was affected by the policy in the same way and/or every family had some children exposed and others not exposed to the policy. The problem: the policy may not affect all families the same way, and we're only identifying the effect on the families who are treated. In the example in the paper, treated families are more likely to be big families and big families tend to be more strongly impacted by the policy (Head Start, in the example). 

So if this were just a paper describing some problem with the way things are typically done, it would be..well, depressing. But the great news: the authors suggest a reweighting technique to get us the average treatment effects! Hoooray! 

Thank you, Na'ama, for the twitter thread. So helpful.

Monday, August 19, 2019

How to Land a Publication in the Journal of the European Economic Association

Have a look at this Q&A interview with Juuso Välimäki, Managing Editor of JEEA from 2015-2018. My favorite part is his discussion of what makes a paper "general interest": 

A successful paper should have an impact on the way the profession views its subject matter. This is quite an easy task if the paper is the first written on a particular topic, and in this case the assessment is more on the generality and external validity of the findings. A paper on a well-explored topic should make us reconsider either the forces behind a result or the empirical support for the results. I should emphasize that overturning existing views is by no means the only way of achieving this. Finding corroborating evidence for existing hypothesis from new datasets and new empirical methods is also valuable.

Click on the link to see more. 

Yes, use those guidelines to decide whether to send your manuscript to JEEA, but I think the advice is even more helpful for deciding which papers to work on in the first place. ***With an important caveat: That you're working on something. Too often I see students struggling to come up with an amazing paper topic and don't start working on anything until they're about to hit some binding department deadline. My advice: write down ideas. Lots of ideas. Even bad ideas. Talk to people about those ideas and maybe they can help turn them into good ideas. Once you have a list of potential ideas, use the guidelines about what makes a successful paper to choose which to pursue. 

P.S.
I also really like the advice on how to write cover letters for journal submissions: 

JV: When submitting my own papers, I have used the cover letter: “Please consider the attached manuscript YYY for publication in XXX”. For most cases, this is sufficient. If there are special circumstances relating to the data sources or issues of conflict with other simultaneous pieces of work in circulation, these should be explained in the cover letter.

Friday, August 9, 2019

Cool Data Alert: Education and Criminal Justice Edition

I just learned of some really amazing-looking data publicly available for all to use. The Michigan Education Center has data on K-12 staffing, finance, and even test scores! The Criminal Justice Administrative Records System (CJARS) has data following individuals through the criminal justice system. 

PhD students looking for dissertation ideas, why not just browse through the data while you're procrastinating doing something else. Chances are, nothing will jump out at you right away, but maybe in a month or two (or three or four), you'll be at a seminar or reading a paper or going for a run, and that's when the idea will come.

Thursday, August 8, 2019

How to Tweet/I'm Famous on Twitter this Week

I'll start with my excitement for the week: Econ twitter giant, Scott Cunningham, has a new job these job well these days (well, in addition to his usual one at Baylor). He is Associate Editor of Research Impact at the Journal of Human Resources. Basically, he promotes new and forthcoming JHR articles using twitter threads and interviews with authors. This week, he promoted my article (coauthored with Catalina Amuedo-Dorantes) on how binding caps on H-1B visas affect career paths of international students. I was nervous about the interview, but I will admit that it was really fun to be famous on twitter for a day! 

For those of you who are not on twitter but are interested in taking a peek, see this beginner's guide to #EconTwitter. Many good tips on getting started. My own piece of advice: #EconTwitter can be so useful, not only for getting career advice (it's where I get most of my inspiration for my blog) and learning about new papers but also for helping you feel part of a community. Careful though: if you spend your entire day everyday getting career advice vs. actually writing papers, you probably won't get so far. Maybe tread with caution but happy tweeting!   

Image result for twitter logo

P.S.
You can follow me if you like: @FurtadoDelia. 

Saturday, August 3, 2019

Principal Component Analysis (and Your Great-Grandmother)

Confession: I use principal component analysis in my papers every now and then. I'm sure I read and thought about the math behind it the first time I used it, but recently, I rather mindlessly just type pca into Stata whenever I have many potential variables measuring the same thing, and I'm not sure which is best. 

So what exactly is Stata doing in the background to create that index of the different measures? Check out this excellent explanation. My favorite is the moving lines. What a great way to show what is going on! 

But what makes it such an excellent explanation? The different ways to explain the same thing! My challenge to all of you: Pick a tricky topic, any topic (examples: your job market paper, instrumental variables, lasso). Start by explaining it to your great-grandmother, then your grandmother, ...all the way down the line up until you need to explain it to an expert in the field. If you can explain it well to all of these people, you know it well. 

Hmm..I wonder if I should use this type of exercise as a problem set question one of these days. 


Tuesday, July 23, 2019

What Not to do in Graduate School

See this article in Nature for advice on what not to do in graduate school. It actually kind of surprises me how appropriate advice meant for hard scientists (the ones that do their work in a lab) is for social scientists doing data work with Stata!

Some of my favorite big lessons (in no particular order): 
1. More work is NOT always better
2. Don't always trust your data----if it's saying something that seems too good to be true, it may very well be too good to be true.


Friday, July 19, 2019

This Happens.

You have come up with an important question, you have the perfect data to answer the question, you have come up with a solid identification strategy, you have no mistakes in your code, but then...

Image

What to do when this happens? See David Evans old blog entry here. Good journals will publish this type of work, but it needs to be done well. Also, they should really change people's priors. If no one believes that X will affect Y and find that indeed X has no impact on Y, well, that's probably not going to a top journal. But if everyone takes for granted that X affects Y and you find no evidence of this, then that's something. My favorite recent example of this is this paper showing that nudging college students to study, doesn't really help. Ok, but what if you find yourself in the first category. No one really thought X would affect Y and "surprise", you find no evidence of it. Well, there's a journal for those results, too! The Journal of Unsurprising Results in Economics (SURE). Read more about it here. I'm really excited about this journal, not only because it may be a home for future papers, but because it's good for science! Those insignificant, unsurprising results also help us learn about the world. They shouldn't all be hidden in people's hard drives and filing cabinets. 

P.S.
But before concluding that there is no effect, be sure to check your code for coding errors. And now check again. 

Sunday, July 14, 2019

Beamer Tips

Job market candidates! I know it's mid-July and you're perfecting your job market papers. But if you can't stand to look at Stata for another second and writer's block has made it impossible to revise that introduction (again), maybe you can start working on your slides. 

Have a look at Paul Goldsmith-Pinkham's super useful tips for making excellent Beamer presentations! He even includes the code. I really like his idea of using TikZ to make figures for showing difference in differences timing (see page 45) of the slides


Image result for beam me up scotty

Tuesday, July 9, 2019

Calvin and Hobbes and Referee 2


There are certain things we only do if required to by about an editor or referee. Sure, sometimes referee 2 recommends things (without much thought) that are just too hard and not worthwhile for the paper. But sometimes, those recommendations make not only for a better paper but they make you a better researcher. Always good to have more tricks. But be careful about investing too much in tricks that are not worthwhile (unless a referee at a good journal insists)...


Here's the link to the comic.


Monday, July 1, 2019

Cool Data Alert: NCHS Data Linked to HUD Housing Assistance Program Files

Yeah, yeah...that Scandinavian register data is amazing, but these days I'm pretty excited about new links being made between large U.S. surveys and administrative data. For those of you interested in the relationship between housing (or housing-related policies) and health, I have great news! Copied from an email I just received

NCHS has linked 1999-2016 National Health Interview Survey (NHIS) and 1999-2016 National Health and Nutrition Examination Survey (NHANES) to administrative data through 2016 for the Department of Housing and Urban Development’s (HUD) largest housing assistance programs: the Housing Choice Voucher program, public housing, and privately owned, subsidized multifamily housing. Linkage of NCHS survey participants with HUD administrative records provides the opportunity to examine relationships between housing and health.

For more details, visit this website

I have used the NHIS before, and I can say that sample sizes are large (large enough even to study immigrants!), and there are many, many interesting variables. Although the survey focuses on health, there are questions related to income, education, country of birth, etc. 

The downside: To use many of the most interesting variables, you have to go to a restricted data center. 

The upside: You can very quickly and easily get a sense of the NHIS data from the IPUMS page before traveling to such a center. 

And Even More Advice on Writing Referee Reports

Summer is great for getting research done because we have uninterrupted time to work on projects. I feel like a good chunk of my time during the school year is spent figuring out where I left off on a project before being distracted by teaching, meetings, etc. But I just got back from a lovely trip to Belgium, don't remember where I left off on any of my projects, don't know which to tackle first...and so decided to get some referee reports written.  :) 

I happened to come across this advice column on writing good referee reports (thank you, Academic Sequitur). I really like the general advice that my main job as a referee is to decide whether the paper is publishable in the journal or not and then to make the case for or against to the editor. Although it is certainly nice to make suggestions for improving the paper, that is not the main responsibility of the referee. But then why do I spend so much time making such suggestions even when I know the paper will be rejected? Because I know it is so hard to get feedback on papers outside of the refereeing process. Yes, some people present at various prestigious conferences/seminars and get excellent feedback that way, but my sense is that many papers are written and published without ever being carefully read or thought about by anyone but the authors and referees. This is a shame. Especially for early-career researchers.  

Then again, it is important to keep in mind when writing these reports that what is most useful for the authors (and the editors) is not my pointing out the typo on page 21, but my evaluation of the paper in general and my thoughts on the "must do's" vs. "nice to do's". 

Ok, and now, back to referee reports....

Friday, June 14, 2019

Trying to Think of Ideas for Dissertation Papers?

Here is the quote for you: 

“It is not often that a man can make opportunities for himself. But he can put himself in such shape that when or if the opportunities come he is ready.”

― Theodore Roosevelt

Coming up with ideas for good papers is hard. Sometimes they come out of the blue and the data cooperate. Sometimes, they....don't. It's hard to predict when the ideas will come. The important thing is to be prepared. Know the literature. Write down fragments of ideas, even bad ones. Keep up to date on interesting identification strategies. Be prepared so that when a good idea comes your way, you're ready to recognize it and implement it.

Stata Trick: Plotting Coefficients with Confidence Intervals


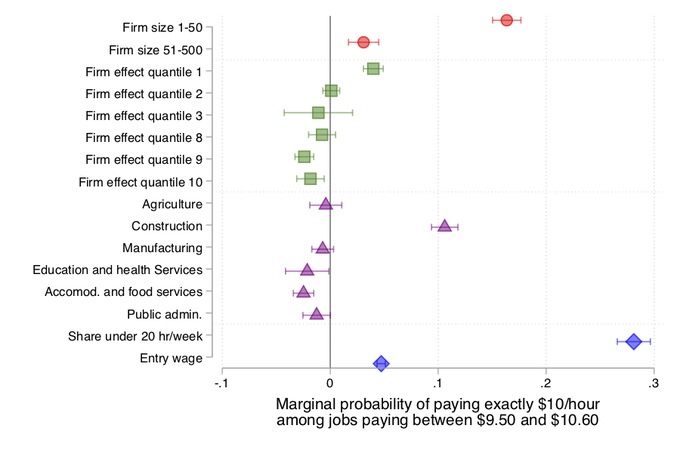
Arindrajit Dube (@arindube) just tweeted code for plotting regression coefficients with confidence intervals. As if that were not enough, he also plots the different categories of coefficients in different colors with labels for the categories! So helpful! Click here for the twitter thread. 

This is what the code produces in the end:

Image

Saturday, June 1, 2019

Your Grant Proposal Just Missed the Funding Cutoff? Hoooray!!!

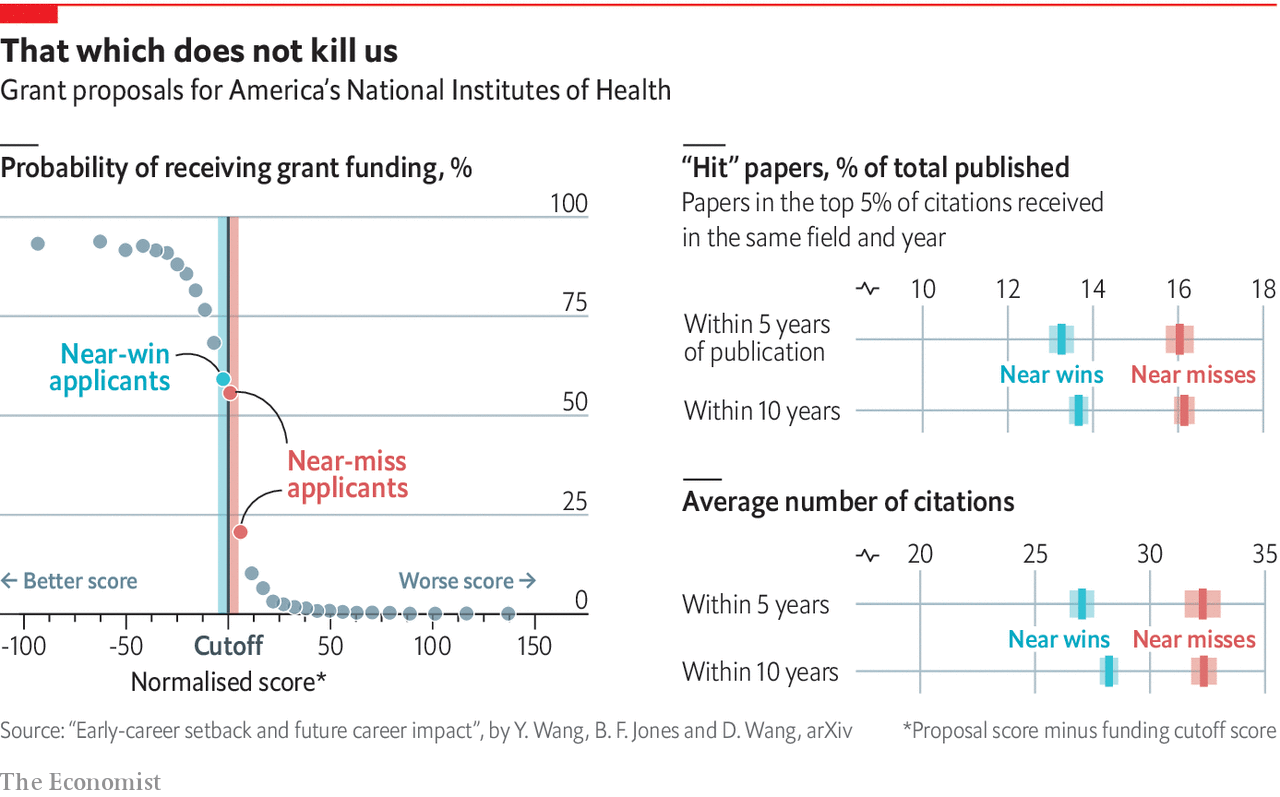
Good career success is on its way! See this article or you can just have a look at this picture published in The Economist describing the article:


"The authors discovered this by collecting data on grant applications submitted between 1990 and 2005 to America’s National Institutes of Health (NIH) by junior-level scientists. In particular, they focused on two groups of applicants: those who received relatively high scores on their submissions but just missed getting a grant, and those who scored similarly well but just succeeded in being awarded one.

The three researchers found that, rather than automatically holding the failures back, as the Matthew effect might be thought to predict, an early-career setback of this sort was sometimes associated with greater academic success in the long run. While those who missed out on funding were more likely to drop out from the NIH system, the scientists who persevered and continued to apply for grants after their initial failure outperformed their counterparts who had succeeded first time, as measured by the number of citations of their research that they received over the subsequent ten years."

So carry on! Don't give up! Keep working!

Tuesday, May 28, 2019

Triple Differences Models

We all remember the first time we were introduced to differences in differences models. Was it the Card and Krueger minimum wage paper? Was it Card's Mariel boatlift paper?  You surely saw the nice tables with before and after in the treatment and control groups. Pretty intuitive, right? A bit more complicated to link the tables to regression estimates but doable. Since then, you've added to your difs in difs repertoire and maybe you've even done a few triple differences analyses. Everything is OK until...you go to write up your results and realize that the estimate on that triple interaction is not so easy to explain! Don't worry, we've all been there. 

My suggestion: Have another look at my favorite explanation of differences in differences (in differences) models. This video starring my colleague, Nishith Prakash, and his coauthor, Karthik Muralidharan. Then make similar diagrams for your own paper. Tell your story in the same way that they tell their story about bicycles. Maybe make a video? I think this will help you to tell your story in your paper. 

I also recommend reading the section on triple differences in Scott Cunningham's online book, Causal Inference: The Mixtape. I really like the entire chapter on differences in differences (starts on page 263), but I especially like the discussion of differences in differences in differences (starting on page 273). He provides lots of examples of papers that use triple differences techniques. You can refer to them to help you write up your results. He also provides sample Stata code for a DDD model! 

Thank you, Shiyi, for inspiring this post! I hope it's helpful.

Wednesday, May 22, 2019

It's May and You're Going on the Job Market Next Year?

Random trivia about me: May is my favorite month of the year! Sure, the better weather. Flowers are blooming. I survived the end of semester craziness. But the biggest things: It's the beginning of the summer break, and I have such high expectations for all I'll get done by the time classes start again. May is the month of promise and hopefulness. 

Ok, but for those of you planning on going on the market this coming year: Don't get too relaxed. There is lots to do this summer. See this very helpful twitter thread written just for you. The big things: Start writing! Spend time polishing your papers (e.g., make sure you put your footnote after the period). And also, don't ignore your advisors over the summer. Yes, they may be basking in the glory of May (see above paragraph), but they also want you to do well on the market next year and may not have as much time to help you once the semester starts. 

From our friends at PhDComics:
Image result for phdcomics, summer

Sunday, May 19, 2019

Read this When Your Paper Gets Rejected

It turns out that rejection improves the eventual impact of the paper. See here

This past Monday, one of my papers was rejected at a good journal. Of course it wasn't a happy day, but the referees' and editor's comments were very good. Since then, my coauthors and I have been brainstorming, and I really believe the new draft of the paper will be significantly better than the draft we submitted.

Also, listen to this by Adam Grant. 

But editors, take note...this does not mean I want you to reject more of my papers in the future. :)


Tuesday, May 7, 2019

Should We Use Figures for Statistical Inference? Evidence from RD

Alternative titles of this blog entry: 

Is the .05 P-Value Threshold too Lenient? 
or
When In Doubt, Simulate! 

But here goes: 

Whenever I teach RD design, I always urge students to make the pictures. In fact, I think the reason I love RD so much (and dislike IV so much) is precisely that we can see the magic right in front of our eyes. But every now and then, I see an RD figure that is .. less than impressive. And I find myself doubting the results. But should I?  

Kirabo Jackson wondered the same thing, and so he made a gif to show us simulated RD plots associated with various t-statistics. Brilliant! Yes, when the t-statistics are really big, the plots are beautiful, but even with a t-statistic of 3.8, the plot is "less than compelling". Clearly, our standards for beautiful RD plots are much more demanding than our standards for beautiful tables. So what should we do? Be more lenient with the RDers? More demanding of our tables? I'm not sure---read the comments for more insight on that. 

In the meantime, another big lesson: If you're ever not sure of something, simulate it! Read the entire thread. Kirabo includes the very simple simulation code he used to make his gif.


Friday, April 26, 2019

Read This When Your Annoying Advisor Asks You to Rewrite that Introduction...Again

A new paper,  just published Economics Letters, measures the "readability" of the introductions to papers published in the American Economic Review, and then shows that the most unreadable papers have fewer citations.

I never realized it was possible to objectively measure readability, but it seems not only does such a metric exist, but you can test the readability of your own introductions here.


Wednesday, April 24, 2019

Another Writing Tip: Write First Drafts by Hand

Fun fact about me: Whenever I have something really difficult to write (for example, the first draft of an introduction), I always write it out by hand in a notebook, ideally with a nice pen. I have done this ever since I can remember despite not really understanding why I do it. Shouldn't it be easier to write first drafts on a computer so that it's so much easier to rewrite? It turns out that there is scientific evidence supporting my "seemingly irrational" style. 

Read this article showing that old-school writing tools (like pen and paper) increase creativity, concentration, etc.! 

Why? "The reason these writers choose old-school tools is that when it comes to writing, computers are too efficient and make changing things too easy, and this ease can slow things down. Writing by hand allows writers who pen their drafts to proceed in a linear fashion rather than continually being tempted to rearrange words on the screen before they know precisely where the story is going." 

I like to write by hand because it feels..less official. I can write anything in my notebook. I will have to rewrite anyway on the computer. I have no idea if this makes sense, but I will stick to it. Another perk: turning off your computer means no interruptions from email and twitter, etc.! 

Read the entire article for more science and more famous people who like to write things by hand (like J.K. Rowling and Stephen King). 

But my favorite advice from the article on how to write: “one word after another.”  Love it! 

Tuesday, April 23, 2019

More on Writing Introductions

In the past few weeks, several of my students have been busy perfecting their introductions. What I have been trying to tell them: Writing introductions is really hard! Nobody writes a perfect (or anywhere close to perfect) introduction the first time around. But they're really important. Not only because often that's the only part of the paper that actually gets read, but also because writing that introduction helps you think more carefully about your own paper--why it's important, what you actually do, etc. Often times, it is when I'm writing the introduction that I think about how to improve the paper. 

But when you're first starting, it is of course helpful to have a guide, a step-by-step approach. I have already shown you one formula for writing introductions.  Of course, use that as a starting point, but I will say that different papers often require different formats. 

The good news: You are (probably) not writing the first ever paper on your topic.

What does this mean: You can use the most closely related papers as a guide ("as a guide" does not mean, copy the structure exactly!) for writing your own introduction. 

My specific suggestion: Find the 3-4 most closely related papers to yours. One should use your empirical technique, another one with your dependent variable, another one using your data source, etc. Write outlines of all of these introductions and think about why the authors chose that particular structure. Then write your own potential outline for your introduction. Better yet, maybe write two potential outlines. If you're my student, feel free to show me your proposed outline before getting into the details of paragraph structure. 

For insights on how to make and think about these outlines, see this guide on how to write introductions written by Raul Pacheco-Vega

And then get to writing. And rewriting. And re-rewriting.

Saturday, March 30, 2019

Cool Data Alert: Administrative Tax Data

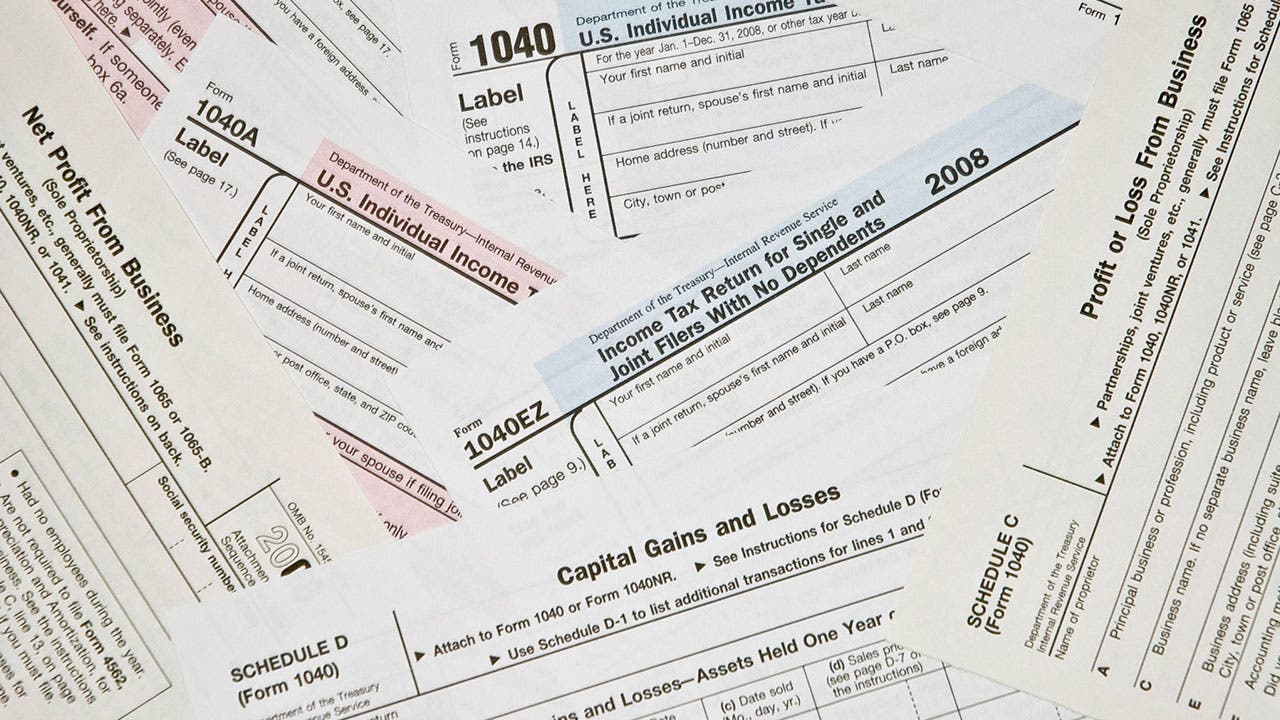
I think that by now, everyone has heard of the pretty amazing findings of Raj Chetty and his coauthors regarding social mobility in the U.S. and how this depends on where people live. How were they able to learn so much about the world? Administrative data from the IRS. I have on more than on one occasion sat dumb-founded wile looking at the graphs and figures that have come out of the Opportunity Insights project. 

But how did a pair of academics get access to these data? This article tells the story. 

You may be more interested in how you can get access to tax data. The bad news is that it is still quite tricky to get IRS data. The good news is that tax data from other countries seems quite "get-able". See this blog post explaining the different types of tax data, where to access the data, and a bit on the practical steps towards acquiring access. 

My guess is that different countries collect different types of information on their tax forms. You may be able to answer some very important questions by looking into what is available in different countries. 

And if your dead set on studying the U.S., the Opportunity Insights project provides quite a bit of aggregate data for anyone to download and use. 

Image result for taxes

Saturday, March 23, 2019

And More on Those Pesky P Values

I never really thought about statistics/econometrics being such a political subject, but I guess it is. A recent article in Nature comes with a list of over 800 signatures rising up against statistical significance!

There is much to like about the article. Many things to think about. I do often see students in my office really excited about a placebo regression with statistically insignificant estimates--despite the fact that the point estimates are just as large (or larger!) as those in a baseline regression. That's not exactly what I want to see in placebo regressions. I've also seen people really excited when they get stars even though the point estimate are just too big to be believable!

I think ignoring estimate magnitudes can be a mistake when trying to write good papers. Paying too much attention on those little stars also makes for bad science. One of my favorite quotes from the article:

"Statistically significant estimates are biased upwards in magnitude and potentially to a large degree, whereas statistically non-significant estimates are biased downwards in magnitude. Consequently, any discussion that focuses on estimates chosen for their significance will be biased. On top of this, the rigid focus on statistical significance encourages researchers to choose data and methods that yield statistical significance for some desired (or simply publishable) result, or that yield statistical non-significance for an undesired result, such as potential side effects of drugs — thereby invalidating conclusions."

So what does the article recommend?

"...we recommend that authors describe the practical implications of all values inside the interval, especially the observed effect (or point estimate) and the limits."

I definitely think that's a great idea. Think about what the estimates in the specific context of your paper. For some questions, a wide interval of potential estimates is still interesting. For other questions, maybe not.

Am I ready to abandon discussion of statistical significance all together? Maybe not yet. Those stars are a nice and easy way to determine how confident we should be that there is enough data/variation in the data to be able to learn something about the world. Sure, thresholds may not be ideal for many reasons, but they do provide a quick way to make comparisons across studies.

So, how about this? Let's keep the stars but maybe report p values instead of standard errors? Would that be so crazy? And I'm all for pictures of estimates with confidence intervals around them.

The authors of the article hope that abandoning statistical significance will get people to spend less time with statistical software and more time thinking. I'm up for that!

P.S.
I have had this song in my head the entire time writing this post: https://www.youtube.com/watch?v=79ZLtr-QYNA. Enjoy!

Friday, March 15, 2019

Why IVs Can Be Really Tricky---Even the Good Ones!

After several discussions with a colleague last week, it has come to my attention that I may be more critical of instrumental variables approaches than the typical applied micro economist. To be clear, I'm not talking about the use of IVs within RD or RCT designs. I'm talking about your standard IV paper. And I'm not even sure if the phrase "critical of" is the right one to use. After all, I use IVs in several of my papers. Maybe a better phrase would be "cautious about" or even "careful when using"...

In any case, there are some IVs that I tend to really like. One example: "judge-leniency" IVs. In a recent blog post, David Mackenzie explained the basic idea behind these IVs with an example from Kling (2006, AER). Imagine you want to know the impact of incarceration length on subsequent labor market outcomes. It's almost impossible to answer this question with standard OLS approaches because, as David writes, "people who get longer prison sentences might be different from those who get given shorter sentences, in ways that matter for future labor earnings." What to do? Exploit the fact that some judges are more lenient than others when sentencing. This means that people who, by pure luck, end up with a lenient judge will have a shorter sentence for reasons that have nothing to do with them. Pretty believable, right? At least, I buy it. And the excellent news is that this main approach can be used in many different scenarios with different types of "judges" (see the blog entry for examples). 

But it turns out that even with this really great IV, there are still problems, besides the most obvious one that you need access to lots of administrative data to be able to do this. First, you need to really know the institutional details about assignment. Are the judges really randomly assigned? The second is about the exclusion restriction: Even if the judges are randomly assigned, are we sure that the only way they affect outcomes is via your variable of interest? A third is about the monotonicity assumption, something we do not typically have to worry about in other IV contexts. Again, read the blog entry for more details. 

For now, I will leave you with this. IV approaches can often allow you to answer really important questions in very precise ways. I will certainly not tell you to omit the IV estimates from your paper. I want to see those numbers. It's just that I strongly urge you when writing up your results to be very careful about emphasizing where identification is coming from. As such, my preference is usually to focus on the reduced form estimates instead of the IV estimates. The reduced form is really where the magic is--IV estimates are just an interesting way to (potentially) interpret those reduced form estimates (but only under certain assumptions). 

For a discussion of the problems with an IV that I often use, see here.  For a more sympathetic view of IV approaches, I urge you to get in touch with my colleague, Jorge Agüero, who has developed some of his own really cool IVs.

Saturday, March 9, 2019

A Reminder: Best Coding Practices

You are human. You will make mistakes. You are human. You will forget things. 

Maybe my best advice is just to recite those four short sentences out loud every time you open Stata.  But what does your fallibility imply for how you should code? Tal Gross has some excellent rules of thumb. I will summarize them below in case the link ever stops working.
  1. Use sensible names for variables and dofiles. For example, instead of calling a new variable "sex", call it "female". 
  2. Comment everything! //You won't regret it! 
  3. Make code readable. Put spaces before and after "+" and never ever put anything after a { or }. Go to the next line immediately. 
  4. Create sections with ***************. 
  5. Make code portable by making appropriate use of folders. 
  6. Check your work. No, this doesn't mean reading lines and lines of code over and over again. It means things like summarizing variables right after creating them. Anything suspicious? 
  7. Use a template. 
  8. Preserve source data. Never ever change the original data source ever. Create new data files. 
  9. Don't repeat yourself. Speaking of repeating myself, many of these tips are sounding familiar. I think I have blogged about this before. Yes, I have! Read here. That's Ok. These tips are worth repeating. Lines of code are not!

Friday, March 1, 2019

"I Just Got a Journal Rejection. Now Where Should I Send My Paper?"

I feel like I have said those exact words so many times to so many people. To all of my former advisors, colleagues, friends, random people at conferences, family members, neighbors, etc. who have helped me think through this, thank you. Today I guess I paid it forward (a bit) by having this exact conversation with a former graduate student of mine. I decided this deserves a blog entry. 

The good news is that there are people out there that have thought about this more carefully than I ever have (well, at least there is one person). Who, you ask? Her name is Tatyana Deryugina, and she gives excellent advice. I recommend that you read her blog regularly. 

Step 1: What to do after a rejection? The first thing to note is that rejection is part of the publication game. I will add that, unless you're always publishing in the very top journal(s), if you're not getting rejections, then you're not aiming high enough. 

My favorite piece of advice she gives: "It can be tempting to either (1) ignore the reports completely and send the paper back out as soon as possible or (2) treat the reports as a revise-and-resubmit and try to address all the reviewer’s comments. Neither approach is generally a good idea,.."  Read her blog for details on why, but she is exactly right. I have made both mistakes in the past. 

I will also add that when you first start a tenure track job, people will encourage you to send your paper to the very top journals. I think this is excellent advice in general, but as the tenure clock keeps ticking, be careful. You do not want to be in the position that because your paper spent too much time bouncing from top journal to top journal, you skip over the perfectly good top field journals simply because you have run out of time and need a publication right away. You also don't want to skip the appropriate journals just because you're emotionally exhausted from all of the rejections. Again, aim high! At least to start. But be aware of the risks. 

Step 2: Where should I send my paper next? Basically, the answer is to figure out where similar papers have been published recently and send it there. Click on the link for practical tips on how to systematically do this. 

Good luck! 

cDwk9fQ

Sunday, February 24, 2019

Stata Hint: How to Address Potential Problem with Amazing Data..

The typical problem in research: We have a great idea, a great identification strategy...but we can't find a variable we'd need in any existing data set. 

Another "problem": We find an amazing data set with multiple measures of that variable. Or maybe the data is large and rich enough that we can cut the data in many, many different ways to do subgroup analysis. 

What's the problem with that? The problem is that if we run enough regressions, by chance, we should get at least one estimate of interest with a p-value of less than 0.05. This is nothing to be excited about. So how do we adjust our standard errors to take into account that we're running multiple regressions? 

One answer: Westfall-Young adjustments 

Great news: It's easy to implement in Stata, even with clustered standard errors. See this twitter thread explaining it. Or see here for a more detailed explanation. Or just type “ssc install wyoung, replace” into Stata and then read the help file. 

Thank you, Julian Reif and coauthors, for sharing this very useful resource with all of us! 

Friday, February 15, 2019

More on Writing Referee Reports

Alternative title for this post: How to write a paper by backwards induction!

I found this handy dandy template for writing a referee report. Thank you, Plamen Nikolov. Yes, have a look at it before sitting down to write a referee report. But I thought that it is even more useful as a checklist you should go through before sending your paper out to a journal. If you can't answer the questions in the template very quickly and relatively easy, your paper probably isn't yet ready to be sent to reviewers.

Also, (re-)read the Journal of Economics Perspectives piece on how to write an effective referee report. 

Stata Hint: How to Add Standard Errors to Bar Charts

Quick, name a difference between top researchers and mediocre researchers! Ok, lots of potential answers to this one, but here's my favorite: top researchers present pictures that very clearly show their main results. Mediocre/lazy researchers present tables that people can barely see much less understand. 

But how do you present a picture, let's say--a bar chart, while at the same time showing how confident we should be in any differences? David McKenzie and, more recently, Benjamin Daniels, have the answer for us: Add standard error bars


2019 Economic Demography Preliminary Program

The preliminary program for the 2019 Economic Demography Workshop (EDW) has been posted. Stay tuned for more details--especially about discussants. For over twenty years, a group of economists have gathered on the day before the annual Population Association of America (PAA) meeting to hear and discuss six or so papers in demographic economics. The papers and discussions are always excellent, and I expect this year to be no different!

Saturday, February 2, 2019

How About Those Effect Sizes?

We're all guilty. We run those regressions and just hope to see those little stars, those p values less than .05. Often students come to my office excited to show stars without even peaking at the coefficient estimates. Drafts of papers are written that say "and the estimate is significant" without even mentioning what the estimate is, never mind trying to figure out whether it is big or small or even reasonable. 

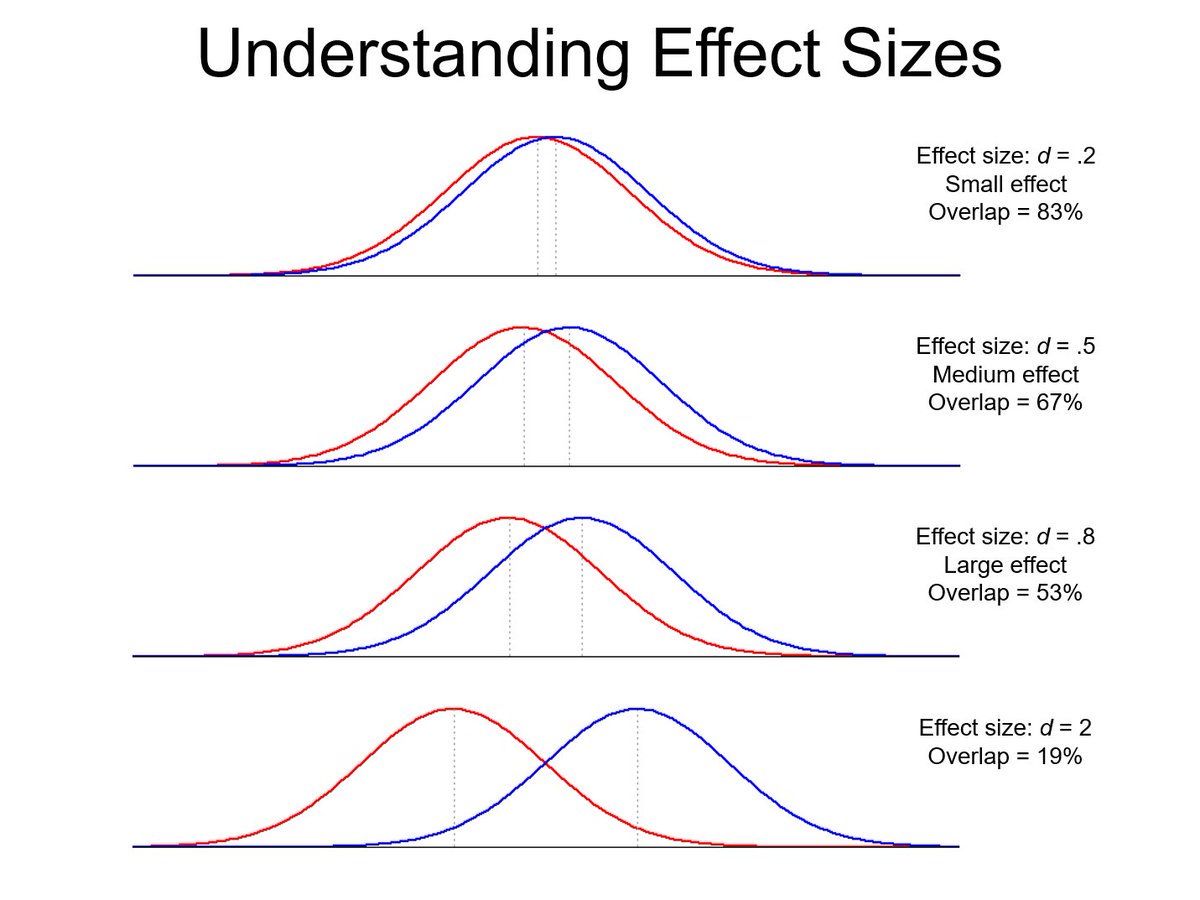
But what is the best way to interpret our estimated coefficients? How do we put those numbers in perspective, especially when our variable of interest is an index or test score or something else that readers may not have personal experience with? One possibility is to say something like, "the effect size is about half a standard deviation.." What does this actually mean? My old friend, Lionel Page, comes to the rescue with some handy dandy pictures. Even with effect sizes of 2 standard deviations, there is still quite a bit of overlap in the two distributions! By all means, compare means...but please, stay humble!