Wednesday, December 28, 2016

Are Those Unobservables Really a Big Problem?

Is there anything to be done when we get that nagging suspicion that some unobserved factor is driving our results? Should we just send the paper off to a journal and hope for the best...or can we learn something about omitted variable bias using the variables we do have in the data?

One commonly used trick is simply to check if estimates of our coefficient of interest change very much when more and more control variables are added to the regression model. To take a classic example, if we want to estimate the impact of schooling on earnings, we may be concerned that higher ability people have more formal education but would earn higher wages regardless of schooling. To address this issue, researchers may control for parental education, AFTQ score, number of books in the childhood home, and the list goes on and on. If the estimated impact of schooling doesn't change very much as more and more of these variables are added, we might feel reasonably confident that the estimated treatment effect is not severely biased. Is it possible to control for everything? No. Nevertheless, if our main results don't change very much when we control for more and more things, then our identification strategy, whatever it might be, is probably pretty good.

Sounds nice, right? I do this kind of thing all the time. But what does it mean to "not change very much"? And shouldn't adding some controls mean more than others? Emily Oster has a forthcoming paper in the  Journal of Business Economics and Statistics that formally connects coefficient stability to omitted variable bias. The key insight is that it's important to take into account both coefficient movements and R-squared movements. She even provides Stata code on her webpage for performing the necessary calculations. I have no idea if her technique will catch on, but even if you never use her code, I recommend reading the paper just for the very clear discussion of omitted variable bias.

Happy Holidays!
Monday, December 19, 2016

Machine Learning and Big Data: It's All the Rage this Year

Just like Hatchimals are the "must have" Christmas toy this year, it seems that on the econ job market, machine learning and big data are the "must have" words on job market candidates' CVs. Have a look below at the key words in NBER working-paper abstracts by year (you can also read read the full The Economist article). I definitely think it's time to pay attention to machine learning if you haven't already thought much about it.


For a very easy to read summary of machine learning techniques, I recommend this new Athey-Imbens paper. I blogged about it here. But even for those of us without access to big data, it's important to think about the proper use of these tools. This article does a great job of explaining the promise and danger from these techniques. Good news #1: It seems like machine learning techniques can help us create better policies. Good news #2: It doesn't seem like those of us trained in spotting good natural experiments will be out of a job anytime soon. Read the article for the details.

Saturday, December 3, 2016

Rule of Thumb for Coding: Embrace Your Fallibility!

My esteemed colleague, Jorge Aguero, just showed me this fabulous article, written by a political scientist, providing hints on how not to make mistakes when coding.

The grand insight: The answer is not "just be more careful." The answer is to program in such a way that you find mistakes very quickly.

I urge you to read the entire article at least once every six months, but I'll summarize my favorite pieces of advice here. Again, the most important thing to keep in mind: "humans are effectively incapable of writign error-free code, and that if we wish to improve the quality of the code we write, we must start learning and teaching coding skills that maximize the probability our mistakes will be found and corrected."

How? 
1. Add tests to your code. Run the tests every time you run the code. Examples: If you have state-level data, then you know you can only have 50 observations. If your variable is a percentage, then you know you can never have values above 100 or below 0. Use the assert command in Stata to make sure these things are true. Yeah, this is definitely my favorite tip of the article. Better researchers are probably really good at coming up with these types of tests and use them often. 
2. Copy-paste is the enemy. Never ever copy-paste. Use outreg2 to get tables into excel. Use local (or global?) macros if you are going to do the same thing to several variables. 
3. Comment! Comment! Comment! Things that are obvious when you write the code will not at all be obvious when you get back to revisions six months (or six years) later. 
4. Use informative variable names. You'll get better at this with practice. 

My own addition (sort of): 
6. Copy-edit your code. Make it look nice. Add spacing and use indents. Delete unnecessary code. This will make it easier to read through often. The more you look at it, the more your coauthors look at it, the more likely that you will find mistakes that were not caught by your tests. 

Any other tips? Comment below. 


Thursday, November 24, 2016

Thanksgiving Writing Hint

I just thought I'd send you guys a little reminder about the importance of good writing. Who better to send this message than, my favorite, The New Yorker's Comma Queen. I love her! Here she is with a special Thanksgiving explanation of when to use "like" vs. "as."  Enjoy the video and the turkey today!

Speaking of turkeys, ever wonder why they're so cheap this time of year? Read this.

Friday, November 11, 2016

Chris Blattman's Job Market Advice

Click here.

There are a lot of helpful tips in there! If nothing else, read "the big stuff."  I also really like the part on the major differences between academic and policy jobs. Actually, I really like pretty much all of it.

But let me add my own addition: It is very easy to get overwhelmed by all of this job market advice. Let me remind you that the biggest determinants of your job market success are things that you have no control over by the time you're on the market: The quality of your research (you won't be able to make major changes by the time you're searching for a job), your field (in particular, the number of jobs in your field relative to the number of job market candidates), and your graduate school/advisor (that has already been chosen). Am I missing any others?

My point: Read the advice columns, but don't sweat the small stuff (too much). The important thing is to keep working hard.

Saturday, November 5, 2016

More on Synthetic Control Techniques

News!! There is a brand new NBER working paper on synthetic control techniques! Guido Imbens and coauthor, Nikolay Doudchenko, propose a new technique allowing researchers to relax some of the restrictions in the traditional ADH synthetic control method. Download the paper here, but you can also just have a look at the abstract below:

Balancing, Regression, Difference-In-Differences and Synthetic Control Methods: A Synthesis


In a seminal paper Abadie et al (2010) develop the synthetic control procedure for estimating the effect of a treatment, in the presence of a single treated unit and a number of control units, with pre-treatment outcomes observed for all units. The method constructs a set of weights such that covariates and pre-treatment outcomes of the treated unit are approximately matched by a weighted average of control units. The weights are restricted to be nonnegative and sum to one, which allows the procedure to obtain the weights even when the number of lagged outcomes is modest relative to the number of control units, a setting that is not uncommon in applications. In the current paper we propose a more general class of synthetic control estimators that allows researchers to relax some of the restrictions in the ADH method. We allow the weights to be negative, do not necessarily restrict the sum of the weights, and allow for a permanent additive difference between the treated unit and the controls, similar to difference-in-difference procedures. The weights directly minimize the distance between the lagged outcomes for the treated and the control units, using regularization methods to deal with a potentially large number of possible control units.

Saturday, October 29, 2016

Reading Other People's Code is the Worst...But Also the Best

I would say that one of the best recent developments in the world of research is that more and more journals are making it official policy to post data and code associated with published papers. All of the AEA journals have this policy and so does the Review of Economics and Statistics (ReStat). I think making it easier for researchers to replicate papers makes for better published papers to start with and also results in more and better research going forward.

My official advice for graduate students starting new projects: Check the AEA journals and ReStat for papers using your data and download the authors' code. Look through it carefully. Learn from it. I bet you'll see lots of clever tricks for coding things that appear difficult. You'll also see directly how people describe what they do in the published papers. Yes, I know that reading other people's code is extremely painful, but trust me, it's often worth the trouble. Here is ReStat's data archive. You can download data and code for the AEA journals from the AEA website.

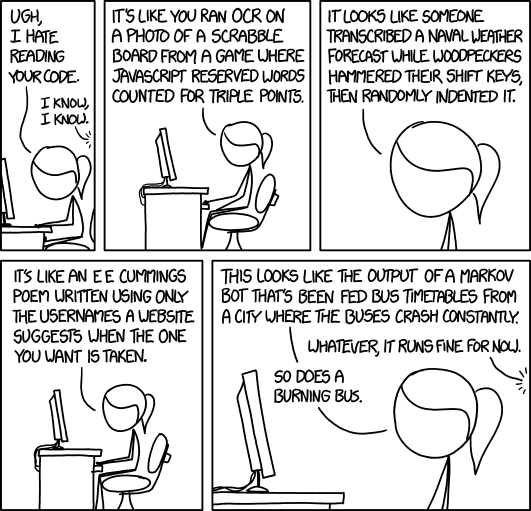
And now I'll end with a plea for you to write good code. From our friends at www.xkcd.com:

Code Quality 2

Monday, October 17, 2016

This Happens.


The question is what to do when it does. What do I suggest? Step one: Check and recheck your code for mistakes. Step two: Take some time away from the project. During that time, think about alternative specifications, why the data are not cooperating, etc. Maybe you were just thinking about the problem incorrectly. Maybe you were not looking at the correct sample, etc. Step three: When all else fails, move on to a different project.

Notice that spending months and months (or years?!?) torturing the data is never the way to go.

Sunday, October 9, 2016

Formulas for Writing Introductions and Conclusions

It's that time of year again! That special time when job market candidates should be perfecting (ie, writing and rewriting and rewriting) the introductions of their job market papers. Writing is hard. Even harder is thinking carefully about what exactly people learn from your analysis and why it's important. Good papers are important for many reasons, and it's tricky to guess which to emphasize. Sometimes you have to write multiple versions of introductions before you can determine what works best.

But what about that very first draft? How do you even start? I just discovered a nifty little formula for writing introductions. Does it work all the time for every paper? Who knows...but it does work often. Definitely a great place to start. And here's a brand new formula for writing conclusions! Use these formulas, but also come up with your own. Pay attention to the format of introductions and conclusions when reading your favorite papers. Then use what works best for your particular papers.

Monday, October 3, 2016

Trouble with the Curve

Oh yes, another post about RD design. I've actually been meaning to blog about this for a while, but I just haven't gotten to it. So, we all know the basic idea behind regression discontinuity. We want to control for smooth function of the forcing variable, and then check if there is a discontinuity at the cutoff. The tricky thing: how to control for the forcing variable given that we don't really know the true relationship. There are basically two potential techniques. It turns out, however, that one is way better than the other. For intuition on the two techniques along with an explanation of why one is way better than the other, click here. For the most recent draft of the paper, click here. For the NBER version, here.

And how about a really cool example of a paper using spatial regression discontinuity? Click here.


Sunday, September 25, 2016

To Be a Good Scientist vs. Good Academic

I just came across an article on "The Rise of the Trump Academic," and I'm really not sure what to make of it. Of course, academic authenticity and integrity are really important. I also think sharing your work is important. I think talking about your work with smart people will increase the likelihood of developing new, good ideas. I think it's important to think carefully about the relevance of your work before submitting it--that's part of your job as a researcher. All of that said, I think the chart below is pretty much on the money.

To my past, current, and future students: I want you all to have successful careers. But I will be especially proud of you if when given the choice between being a good scientist and a good academic, you choose science. I honestly (maybe naively) believe that in the long run, the most successful academics are also the best scientists.

Divergent interests (1 of 2)
Source: @SciPubLab/Twitter 

Friday, September 23, 2016

Impact Evaluation In Practice

OK, that title sounds a little boring, but I just browsed through the newest edition of the book, and I'm really impressed. The book focuses on randomized control trials--especially in developing countries, but there are also chapters on all of our favorite empirical techniques (RD, DiD, etc.).  I especially like the sections describing the limitations of each of the techniques and the checklists.  Super easy and fun to read. The book has pictures and everything! Plus, it's free.

Monday, September 19, 2016

Making Sense of U.S. Geography

Have you ever needed information from two different U.S. data sets? One data set gives you county-level information, the other gives you MSA or PUMA level information. What do you do? Stare at maps hoping things will become clear? Read pages and pages of Census documentation? No! There is an easier way! Just use the Missouri Census Data Center's Geographic Correspondence Engine. Just select your source geocode, target code, and what you want to use for weights. The website will provide you an excel sheet with the appropriate cross-walks and allocation factors!

Remember to cite the page appropriately so that we continue to provide the right types of incentives for these types of "public good" projects.

U.S. Population Density Map

Sunday, September 4, 2016

Constellations in Your Data?

From our friends at xkcd.com:

Linear Regression

Linear Regression


I often get this feeling during RD talks, but that's only because researchers are more likely to show us the data when using RD design. The issue is the same for good ol' OLS!

Wednesday, August 24, 2016

For More Stars, Use XTREG Instead of AREG

I have a secret to share: I'm not sure that I ever realized (or thought much about the fact) that areg and xtreg produce different standard errors. Well, they do, and I have some good news: Often times, the right thing to do is the thing that produces the smaller standard errors! See Fiona Burlig's blog entry for more details.

I really like that she thought through the issue using simulations. Sometimes we spend hours googling answers to our questions when writing a quick little dofile would not only answer the question, but also help us really understand the question.

So, go back to that old project with the insignificant results. Did you use areg or xtreg? If you were to increase the sample size, would you necessarily increase the number of clusters?


Update: Forget xtreg!! Just use reghdfe, like the blog entry suggests! One of my colleagues just reminded me, "It gets the standard errors right, allows for two-way clustering and multiple high dimension fixed effects, and even does IV estimation."  

Monday, August 15, 2016

Life of a Researcher: "I Will Survive"

Fabulous remake of an old classic created by Tavneet Suri's very talented RAs. Enjoy! And remember: Make those scatter plots!

Friday, August 12, 2016

Cool Data Alert: Health Inequality Project

I saw these graphs on the relationship between household income and life expectancy a few years ago and was blown away. Yes, the difference in life expediencies between the richest and poorest men in the U.S. (15 years!) is startling, but what was more surprising (for lack of a better word) to me is that there are such noticeable differences in the middle of the distribution--where I am, where my friends and family are, where you are. I would love to learn more about what is driving these differences. Is it something that you can buy with money? Can it all be explained by good behaviors that happen to be correlated with income? Just plain genetics?

Luckily, the Health Inequality Project team has made really cool data available to help us learn more. UConn graduate students, if you are interested in using these data and need an adviser/committee member, come find me.

Saturday, July 30, 2016

What Makes a Paper Amazing? Good? Bad?

I was at the NBER SI this past week and saw a lot of papers! I can't say that I saw any bad papers (this is the NBER after all), but I did find myself thinking about what makes a paper amazing vs. just really good. I guess the answer is that amazing papers answer important questions in clever and credible ways. Most papers don't do all three but scoring high on even one of these can get you pretty far. I would also add that presenting well makes a big difference.

Anyway, I thought this would be a good time for me to show you this blog post on why research fails. I agree with all three of her points. Pay particular attention to the part at the end explaining when research does not fail (even though it might feel that way).

Addendum: Someone isn't so happy with the state of research in the sociology of education field. I'm not so sure how this compares to the state of research within economics, but I can say that I have had similar thoughts when refereeing papers. It breaks my heart to have to recommend rejecting papers that have potentially good ideas hidden deep within them. That said, there is also the danger of spending months and months to write one footnote that nobody really cares about. Always tricky to figure out when to let go of a paper....I struggle with this. 


Sunday, July 17, 2016

Applied Micro People: Stop Everything and Read this Now

This new Athey-Imbens paper has it all! Intuitive descriptions of the most fashionable identification strategies, plus examples, plus practical suggestions for best practices. The paper does excellent job of describing the strategies we know well (RD, difs-in-difs), but then also describes newer variations of these strategies (RKD, synthetic controls, nonlinear difs-in-difs) that we might not yet have used. My favorite section is the one on supplementary analyses! I have used many of these techniques in my papers, but I have never thought about doing them in any systematic way. There is also a section on machine learning.  I'm not at all familiar with these techniques, but if Athey and Imbens put this section in here, I should probably learn it!

This paper is a must-read for all applied micro students as well as anyone teaching any applied micro class at the graduate level. Actually, all applied micro people should have a look every now and then. Even if you don't use these techniques in your own research, knowing the "state of applied microeconomics" will make you better referees, better seminar/conference participants, better human beings? Ok, maybe not necessarily better human beings...well, maybe.  :)

Friday, July 8, 2016

Adorable Goats Show Us What It's Like to Do Research

This is not what I thought research would be like. I thought the process went something like this: Come up with brilliant idea. Test it with data. Write it up. Send to journal. Move on to next brilliant idea. Actually, even now, I find myself thinking that this is exactly how it works for "other" researchers. But maybe it isn't. Maybe all (most?) researchers do research exactly like these goats accomplish their goals. Enjoy!..both the goat video and the process of doing research!

Saturday, July 2, 2016

Stata Tip: Multiway Fixed Effects

I just discovered a funky little ado file that may be useful when running models with multiple sets of fixed effects on large data sets: rehgdfe.ado. I haven't tried it yet, but here is a description from the help file:

reghdfe is a generalization of areg (and xtreg,fe, xtivreg,fe) for multiple levels of fixed effects (including heterogeneous slopes), alternative estimators (2sls, gmm2s, liml), and additional robust standard errors (multi-way clustering, hac standard errors, etc).

Additional features include:

A novel and robust algorithm to efficiently absorb the fixed effects (extending the work of Guimaraes and Portugal, 2010).
Coded in Mata, which in most scenarios makes it even faster than areg and xtreg for a single fixed effect (see benchmarks on the Github page).
Can save the point estimates of the fixed effects (caveat emptor: the fixed effects may not be identified, see the references).
Calculates the degrees-of-freedom lost due to the fixed effects (note: beyond two levels of fixed effects, this is still an open problem, but we provide a conservative approximation).
Iteratively removes singleton groups by default, to avoid biasing the standard errors (see ancillary document).


Sunday, June 26, 2016

Read This Before (and After) Sitting Down To Write

Marc Bellemare has a nice style guide (see here).

Note that I don't follow all of his writing advice, at least not all of the time. However, it is definitely worth reading. Often. People will take your work more seriously if it looks professional. Also, when I read really sloppy papers, either as a professor/advisor or as a referee, I often feel a bit insulted, like you don't value my time at all. Typos happen. Everyone knows this. But spend time cleaning what you write.

At the very least, reread your papers before submitting them. I just reread this post. Twice.

Addendum: I just happened to re-read a letter I wrote to an editor about a referee report. Caught two typos. How embarrassing! Do as I try to do, not as I always do....?

Saturday, June 11, 2016

Stata Tip: Dummy Variables and Interaction Terms

One of the most frustrating things to happen (all the time) when you're in the Stata groove is to get that error message, "no room to add more observations." Yes, you can usually add more more memory (use the 'set memory' command), and if you can't, you can always buy a new computer with more memory. But insufficient memory issues often come up when you have many dummy variables in your model. I used to make them using the tabulate command:

tabulate var, gen(newstub) 

There's a much better way! You don't actually need to create those variables! Much better to just add "i." to the beginning of your variable within the regression command:

regress y i.var

Done. You can even specify the base and test for equality of different dummy coefficients!

You can use a similar trick for interaction variables. Instead of creating several interaction variables,

generate femaleXgroup2=female*group2
generate femaleXgroup3=female*group3

just use this regression command:

regress y i.sex i.group sex#group 

Actually, even better to do this:

regress y sex##group

I would say that one of the most-often made coding errors I see is to forget to include one of the non-interacted variables in regression models with interaction terms. By using the ## trick, you don't need to worry about it! Oh, if one of the variables is continuous, you need to tell Stata this by putting "c." before the variable. For example,

regress y i.sex age sex#c.age or  regress y sex##c.age

More details here. Or for quick reference, look at the this cheat sheet.

Tuesday, May 31, 2016

What? Causal Identification Wasn't Always a Thing to Worry About?

Read this interview of David Card and Alan Krueger. Imagine that. There was a time in the not so distant past that nobody used the terms "natural experiment" and "research design".  Also, see their thoughts on RCTs, behavioral economics, and complicated theories explaining human behavior. Interesting throughout!

Here is more on the history of applied micro research, starting in the 1960s. Important to note before going on the job market: "We also show that, despite the partial abandonment of theory by applied microeconomists, the labor market for economists still pays a wage premium to theorists." My non-rhetorical question: Doing theory is hard and time-consuming. Is it worth it? My answer: It depends.... 

Sunday, May 22, 2016

At Adam Smith's Grave

I know, I know. It's been a while since I've posted anything. I've been traveling. Yesterday I visited Adam Smith's grave. Pretty cool thing, no?

Thursday, April 28, 2016

Need a Useful Yet Beautiful Graduation Gift? Stata Cheat Sheets

I suggest printing these out (ideally in color) and framing them! They're beautiful! And practical! I love them all...can't wait to start using the keyboard shortcuts.

Tuesday, April 12, 2016

How to Be Innovative

I just saw this Ted Talk on the habits of original thinkers. Really, that's what we're in the business of doing: coming up with innovative ideas and following through with those ideas. Lots of good advice in the talk. My favorite: "The greatest originals are the ones who fail the most, because they're the ones who try the most. You need a lot of bad ideas in order to get a few good ones." And honestly, all you need is a few good ideas. Nobody will care about or even notice all of your bad ones.

I also like his insights on procrastination. No, this does not mean you should wait until the last minute to write that proposal, third year paper, etc.! It does suggest that before hurrying to send that brand new paper to a journal, you should present it at several conferences and share it with trusted colleagues. Yes, you may get good suggestions from them, but even if you don't, it is very likely that you yourself will come up with ideas for substantial improvements while you wait for responses from people.

Tuesday, April 5, 2016

Dominicans Love Regression Discontinuity Design

I just got back from celebrating my little brother's wedding in the Dominican Republic (AKA República Dominicana). I really liked these pens spotted in a gift shop. ;)


Friday, March 25, 2016

When You Don't Have A Good Control Group, Just Make One Up!

OK, maybe I'm exaggerating a little bit. Synthetic controls methods are actually really similar to the typical differences in differences approach except that more weight is given to "untreated" observations that are more similar to the "treated" observations in the pre-treatment period. You can read more about this intuition here, but even cooler--you can download a STATA program that automates the process of running multiple synthetic control estimations. It even generates visualizations of the results!

And now you're ready. All you need to do now is find interesting policy changes enacted in different states at different times. Stop reading this blog and go read the newspaper!

PS
UConn people: David Simon is our resident expert on synthetic control methods.

Saturday, March 19, 2016

An Oldie But Goodie: What Are We Weighting For?

I have recently been struggling with deciding how to use weights in a new project. Sometimes this is straightforward (when using IPUMS data for the 1% sample, use the variable perwt). Sometimes, however, data sets come with multiple weights or you might have to create your own. Weights usually matter for when creating tables of descriptive statistics, but often they do not matter when running regressions. Of course, whether we should use weights should depend on how those weights were created. But before spending too much time reading your data's codebook, it is useful to think about why anyone would want to use weights--ever. For insights, have a look at this summary of the paper, "What are we weighting for?" written by Gary Salon, Steven Haider, and Jeffrey Wooldridge.


Sunday, March 6, 2016

From Student to Scholar

This week, students in my labor class are writing proposals for papers due at the end of the semester. This is kind of a big deal since, hopefully, these papers will turn into "third year papers" which (if they're good) will become chapters of their dissertations. It's been quite something to see students go from a broad interest in a topic to a specific question to a specific answerable question to a specific answerable question that hasn't already been answered. I'm reminded that this stuff is hard! But it's so much fun to see them zero in on a topic that they're excited about! Especially when it comes after a long struggle.

In honor of these students, I thought I'd share some of my favorite pieces of advice on how to go from student to scholar. One piece of advice: Don't be boring. Another: Look for ideas in the world, not in journals. But I actually found my favorite piece of advice in a CSWEP newsletter interview of Anna Mikusheva. She writes,

"The main advice is trivial: always work on something. If you have not found a big, exciting project to work on, work on something smaller—a big project will eventually come your way. If you don’t have even a small project, work out some missing details of a paper you’ve recently read or seen presented, and/or try to answer questions that have arisen during the last seminar you attended. Your big idea will come once you have realized enough small projects." 

She also recommends ambition and patience. I would also add that talking about your ideas to people, especially smart people but really anybody who will listen, can be so helpful!

Sunday, February 14, 2016

Getting Kinky on Valentine's Day

We all know and love regression discontinuity (RD) designs. We use these to estimate the impact of a policy by comparing outcomes for people just below and just above a policy cutoff. Look here for some RD porn. Well now, there's a "kinkier" version of this becoming more and more popular: the regression kink design (RKD). A really nice description is available here, but let me quote the basic idea:

"The regression discontinuity design exploits a jump or discontinuity in the likelihood of being treated at some threshold point. In the RKD design, there is instead a change in slope at the likelihood of being treated at a kink point, resulting in a discontinuity in the first-derivative of the assignment function...For example, Simonsen et al. (2015) use a kink in the Danish government’s prescription drug reimbursement schedule: the subsidy is based on the total prescription costs the individual has paid during the year – there is 0% subsidy for the first 500 DKK in expenses, then 50% subsidy once you have paid 500 up until you have paid 1200, then 75% subsidy, and eventually an 80% subsidy for expenses above 2800 DKK. The result is that the share of the price paid out of pocket kinks as shown in Figure 1:


Figure 1: Y-axis is the share of the price paid out of pocket. It falls as one approaches 500 DKK since if you have spent 480 and buy something for 50, you get 0% subsidy on 20 DKK and then 50% subsidy on the 30 DKK that is expenditure past the threshold."


I have seen this strategy used for estimating the impact of unemployment insurance payments in the US as well. I'm sure there are many other public policies that can be analyzed using RKD. In honor of Valentine's Day, I suggest you go off to find them!  ;)  

Friday, February 12, 2016

STATA Now Sends Txt Messages

I often joke that STATA is the true love of my life. Always there for me. Night and day, year after year. People sometimes respond that STATA can't bring soup when I'm sick, blah, blah.

Well, unfortunately STATA still can't cook for me, but the good news is that it now sends txt messages. Directly to my phone! :)

This module, developed by a Yale graduate student, will send a message to your phone as soon as your program finishes running. Now you can feel free to leave your desk for a bit--maybe do some laundry, maybe make some soup. STATA will let you know when it's ready for you again. LOVE!  

Sunday, February 7, 2016

"It is not in the stars to hold our destiny but in ourselves."

That's a Shakespeare quote. Not sure if this is exactly what he had in mind, but I think it's a great reminder not to get so crazy over small p values that you forget to think about the actual coefficient estimates. Look at the numbers! Do they make sense? Are they believable? Of course, the best case scenario is that the coefficient estimate makes sense and there are a bunch of stars next to it, but when that doesn't happen, read this. Whatever you do, don't stand up in front of reasonably smart people and try to convince them that some crazy, unbelievably big estimate is the right one just because you used an IV. Chances are that the "too big to be believable" estimate is a direct result of using a bad IV.

For now, let me leave with you another quote...


Sunday, January 31, 2016

When You Have Multiple Measures of the Same Thing...

The usual problem when doing empirical work is that you don't have an important variable in your data. Very, very occasionally, you have the opposite problem: Lots of different highly correlated variables measuring pretty much the same thing. What to do? How to choose?

I would say that if the variable is typically measured in a specific way in the (economics) literature, maybe go with that one for your main specification unless you have reason to believe you have a better one. Either way, include a table in the appendix showing that your results are robust across measures. Don't freak out if you fail to see a star for one or two of them. This will happen if you have enough different measures and not a large enough sample size.

Another good option to choosing just one for your main specification is to include a summary measure of all of the different measures. Of course, many ways to create summary measures. Have a look here for a nice discussion of this.

Friday, January 22, 2016

And Now For Cool Migration Data

Here you go! Enjoy! Policy data for 45 countries, wow!

Gender Related Data

To come up with good implementable ideas, it's useful to know what data exist and how to get them, especially data in easy to use format.  If you're interested in gender issues, have a look here. Really interesting variables by country and year!!! Browse through the data---you just may come up with a brilliant new paper topic.

Tuesday, January 12, 2016

Some Teaching Advice

I know, I know. This blog is about doing research. But teaching is also a big (and important) part of our jobs. I especially like to hear about tips for improving teaching that do not involve too much time investment. Here are some examples.  Any other ideas and suggestions?

Saturday, January 9, 2016

How To Talk About IVs with Non-Economists

Some good points about instrumental variables in the article but what I really appreciated is the talk of IVs in a magazine everyone reads.

Enjoy!