Friday, December 18, 2020

Stata Tip: How to Clean String Variables

I know, I know. It's been a while since you've heard from me. You know how some people have been super productive during the pandemic? I haven't been one of them. Oh well. The good news is that I survived teaching my first all-online semester. I submitted grades yesterday! To all of the students who attended the classes live this semester..and especially to those of you who put your camera on every now and then, thank you! To those of you couldn't, do stop by my office sometime when we're back on campus to say hello.  ;) 

And now, to get things restarted on this blog, I thought we'd go with a Stata tip on how to clean string variables. Sure, sometimes we are given nice, ready to go data. Other times, not so much. For example, imagine that sometimes "Delia Furtado" appears as "Delia furtado" or "delia   furtado" or "Delia%&Furtado".  What to do? See Verena Wiedemann's Stata tricks, posted on Oxford's Coders' Corner (h/t David Mackenzie's blog). 

Yes, you could try to find these "by hand," but the more you do automatically, the less likely you are to make mistakes! 

Sunday, October 25, 2020

Cool Data Alert: Historical Data

I haven't done any work using historical data, but I must say I am intrigued! This IZA paper describes some of the most commonly used  data sources (well, by economists). They are broadly classified as geographical data, ethnographic data (really cool!!!) and Censuses. For each group, the authors "outline the issues they raise and also point out which methodological advances allow economists to overcome or minimize these problems." 

If you're a history buff and you're looking for a dissertation topic, take a peek. 

Thursday, October 15, 2020

Stata Tip: Quick and Easy Code for Making Plots

Yes, I've said this. A picture is worth a thousand words. Or in our case, a picture is worth a thousand numbers in a table. The DIME folks at the World Bank have just put together a super useful resource on how to quickly code all of the different types of plots you may want to make. Click on the you plot you want to make and up comes the code that is used to make it! No need to to spend hours googling how to do this for each potential plot. What an amazing public good! 


P.S.I put the the pictures up just to make my blog pretty. To get the actual code, click on the link above. Or here

Saturday, October 10, 2020

10 Commandments for How to Give a Seminar

Kjetil Storesletten gave a talk with the commandments for giving a seminar--maybe specifically a job talk. You can see the slides here and watch the talk here

Stating the question you are asking very clearly and at the beginning of the talk is so important (Commandment 2). Yes, this is of course always important but maybe especially important during an economics talk so that you don't keep getting interrupted with questions that are not really relevant to the question you are trying to answer. The fewer of those "out there" questions you get, the more likely you will be to have well prepared answers to the questions (see Commandment 10). 

I would also emphasize Commandment 4: Show the value-added of your paper. Sometimes newbies want to 'over-emphasize' their work by 'de-emphasizing' prior related work. This is not only dishonest, but you may find yourself fighting unnecessary battles. For example, if some well-respected economist has already used your identification strategy to study some other outcome and that paper is now published in a solid journal, then your audience may not make you work as hard to defend that broad identification strategy. Instead, they will focus their questions on why it may (or may not) be appropriate for your particular application. This is probably a much easier battle to fight and it is the battle you should be prepared for. 

Good luck! 

Thursday, October 8, 2020

Stata Tip: Best Advice on Writing Dofiles

Yes, I know you're excited to see the results of your regression. Go ahead and be sloppy with your coding. You probably will make mistakes. You'll go back to fix them. Maybe that's fine. But at some point, go through these J-Pal instructions and guidelines on how to clean your data. The big rules: 

  1. Document decisions
  2. Never overwrite the original/raw data file
Other gems include: Look at the distribution of every variable you use in your analysis (do you have 500 year olds? Are the missing values set to 99?) Do you see anything suspicious? The more you know about the data, the better. 

Also, use Stata's help command to learn more about "mvdecode" and "subinstr."  And remember to rename variables so that you can tell what they are by looking at the variable (hint: a dummy variable called "male" is more helpful than one called "sex"). Label the values so that you don't have to keep going back to the codebook. 

Tuesday, October 6, 2020

Message to My Students

I just saw this on twitter, and it is absolutely true. I forget to say it, I know, but I am very often very impressed with your work. So impressed that I want to help make it as great as it can possibly be. Please do keep sending me your paper drafts. Do the best job that you can. Fix the typos you catch, and remember to include a date and page numbers. But remember that I don't expect perfection in your drafts. After all, they are drafts


Friday, September 25, 2020

On Nonacademic Jobs

 Yes, I know that most of you decided to get a PhD specifically because you had an academic career in mind. But keep in mind that while you were all exposed to academic careers to some degree while in college, you might not know about the many fulfilling jobs you might have (with that PhD in hand) in the private sector, government sector, etc. I will not tell you which is best for you, but I will tell you to seriously consider all of these options when sending out applications. Read about what everyday life looks like in the different types of jobs. Think about how to prepare for the job market if you're particularly excited about a nonacademic career.  

In this morning's blog entry, David Mackenzie points us to many different and useful resources focusing on jobs for development economists. Have a look here.

Thursday, September 17, 2020

Are You Really Controlling for that Variable?

Yes, we love RCTs and RDs (and maybe sometimes IVs and difs and difs, I guess), but remember the tried and true way to get at causal estimates is just to good old-fashioned control for omitted variables. From a "research is so cool" perspective, it's quite fascinating to see an estimate of interest drop suddenly in response to adding an important control variable. From an "I won't get this published unless I have those stars" perspective, you often hope this doesn't happen...and when is it least likely to happen? When you're sloppy in constructing those control variables or when the variables themselves only imperfectly measure the true omitted variable. 

So what happens when you add a variable measured with error as a control variable in your model? Supplysideliberal.com explains it all here with excellent intuition as well as matrix algebra! Who could ask for anything more. I've copy-pasted the important bit here: 

"Compare the coefficient estimates in a large-sample, ordinary-least-squares, multiple regression with (a) an accurately measured statistical control variable, (b) instead only that statistical control variable measured with error and (c) without the statistical control variable at all. Then all coefficient estimates with the statistical control variable measured with error (b) will be a weighted average of (a) the coefficient estimates with that statistical control variable measured accurately and (c) that statistical control variable excluded. The weight showing how far inclusion of the error-ridden statistical control variable moves the results toward what they would be with an accurate measure of that variable is equal to the fraction of signal in (signal + noise), where “signal” is the variance of the accurately measured control variable that is not explained by variables that were already in the regression, and “noise” is the variance of the measurement error."

But now for some practical advice from me: When you add an important control variable to your model, be sure to show its estimated coefficient in the table (vs. just having an X signifying that you controlled for it). Why? If you know that variable is an important omitted variable, but its estimated coefficient is close to zero and not statistically significant, the culprit may be measurement error. If that's the case, then we shouldn't be surprised that adding this poorly measured variable doesn't change the estimated coefficient of interest. On the other hand, if you can show that the control variable has its expected impact on the outcome AND it doesn't budge your estimate of the coefficient of interest, you're probably good!  

Conclusion 1: Minimize measurement error by coding carefully. 

Conclusion 2 (copied from the blog): "I strongly encourage everyone reading this to vigorously criticize any researcher who claims to be statistically controlling for something simply by putting a noisy proxy for that thing in a regression. This is wrong. Anyone doing it should be called out, so that we can get better statistical practice and get scientific activities to better serve our quest for the truth about how the world works."

Thursday, September 10, 2020

Bellemare's How to Write Applied Papers in Economics

I have blogged before about Marc Bellemare's advice on how to write an introduction, how to write a conclusion, how to write the parts in between. Well, he's now put it all together in one place and added some additional bells and whistles. You can see it all here

My advice: Read it from beginning to end now. Then, when you're actually writing an introduction, read the section on how to write an introduction again. Have it open while you actually write your introduction. When you have to decide where to send your "finished" paper, have another look at the section on where to send your paper. 

Writing a paper is hard. Any paper. Even a really bad paper. This handy guide simplifies the process so it becomes more doable for you. Maybe even better, your papers become more readable for your advisors, editors, referees, and just regular readers. 

Good luck!

Writing Gives Me Too Much Joy to Do It Professionally | by Ryan Fan |  Better Marketing | Medium

Wednesday, August 26, 2020

Occasional Reminder to Download and Memorize the Stata Cheat Sheets

Here they are. Download them. Laminate them. Keep a copy by your bedside, in the bathroom, on your treadmill, and of course on your desk. Enjoy!  

Saturday, August 15, 2020

Choosing Coauthors

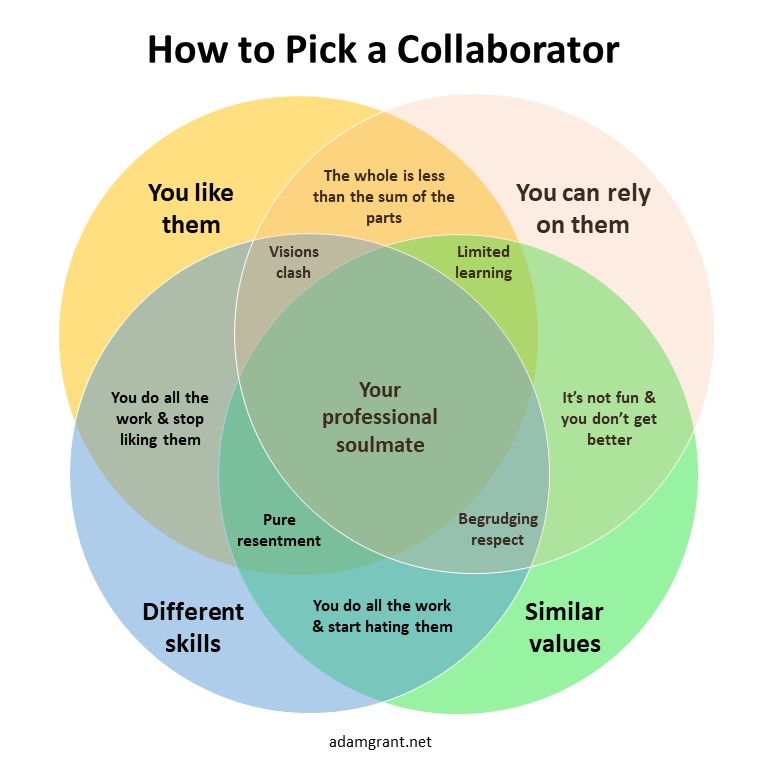
I think one of the most important determinants of success in academia is your ability to get good coauthors. Yes, some of this is endogenous. After all, the better your publications, the easier it will be for you to find good coauthors. But another part is a matter of finding coauthors that work well with you. 

Adam Grant tweeted about this recently and even provided a nice graphic that explains it perfectly. 

Image


And if you find yourself working alone most of the time, consider this post a message urging you to take a chance on someone. Share an idea with a classmate. Email someone you met a conference last year. It is really hard to know whether you work well with a person until you actually try to write a paper together, but who knows. At worst, working on that one paper together will be awful, but at best, you find your professional soulmate! 

Stata Tip: How to Make Multiple Graphs Side by Side

 Yes, I know you know how to make graphs. Yes, you can make them one by one using copy-paste like crazy! If you're a bit fancier, you can use a foreach loop. But these techniques will produce separate graphs which you will then need to copy-paste (?) individually into your paper. If you were only going to make these graphs once and they would then be published, that's perfectly fine. Chances are though that you will make these graphs many many times. For this reason, it's best to invest in writing a few more lines in code to save you time in the future..but even more importantly, decrease the probability of making a mistake in the future. The more you automate, the lower the probability of making a mistake. 

Thank you, SDAS Techtips, for the tip. 

Click here for the code

How to make this: 

Instead of many of these: 

Sunday, August 2, 2020

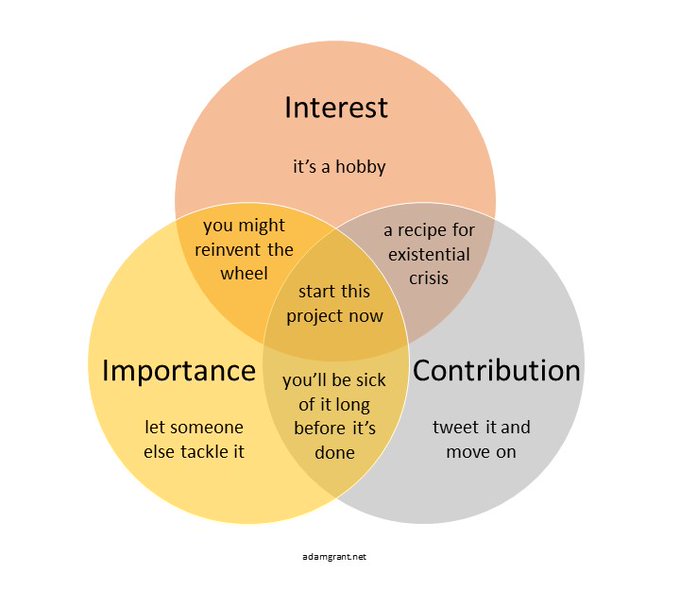
Choosing Topics to Work On

Adam Grant just tweeted some guidance on this. Great advice! But I would add one more thing: Always be working on something. Don't sit around doing nothing while you wait for the trifecta idea. Ideally, you have several different ideas and then among those, you can choose the one closest to the middle. 

Image

Friday, July 31, 2020

Trick for Making Lots of Pretty Graphs In Stata

Two main points to make in this today. 

1. MOST IMPORTANT: Make graphs! Graphs are so much better than tables. Also note: do as I say, not as a I do.
2. But speaking of do's...David McKenzie has a nice trick for how to make those graphs good looking using do files! I'll copy-paste here for convenience, but all credit goes to him. 


 Stata trick I learned this week: often I create graphs in Stata, and then want to pretty them up using Stata’s graph editor. But while you can record what you do in the graph editor as a .grec file, this is a pain for replicability since you need to go in and edit each time. I learned you should do the following steps:

1)       Open the graph editor, start recording, and do the editing you want, and save the editing file as a .grec file.

2)       Then open the .grec file, and you will see a bunch of commands. Take these commands and add gr_edit in front of them in your main do file.

E.g. now my do file would read something like

graph use "output\myfigure.gph"

gr_edit style.editstyle boxstyle(shadestyle(color(white))) editcopy

gr_edit legend.style.editstyle boxstyle(linestyle(color(white))) editcopy

gr_edit yaxis1.title.DragBy -.1931240126534509 -2.317488151841824

Wednesday, July 29, 2020

Spatial Regression Discontinuity: It's Wiggida Wiggida Wiggida Wack!

Ok, I'm not sure if "wiggida wiggida wiggida wack" is a good thing or bad thing, but I do know that regression discontinuity is all about spatial jumps which made me think of a song from my youth, Jump by Kris Kross. I blog a lot about old fashioned regression discontinuity (also all about jumps!) so what's this about spatial RD? Nothing. It's pretty much the same thing except that the running variable is usually about distance from a border. Here's a nice description

One example discussed in the blog entry: Imagine you want to know the causal impact of having access to an irrigation system that uses gravity for getting water from one place to another. Plots just below the canal receive access to irrigation, while plots just above the canal do not. By comparing plots just below or just above the canal, you can get at causal impacts of the canal. 

So what's the difference between spatial RD and regular RD? 
1. In regular RD, there's a single score that determines whether you're just above or just below the cutoff---let's say one test score determines whether you get into your college of choice or not. Spatial RD is often about distance so there's a longitude and latitude component. 
2. If you use, let's say, county of residence to determine distance to a state border, some people in that county may be very close to the border and others quite farther away. 
3. Speaking of exploiting distance from state borders---the problem is that there are often many policies that differ when you cross a state border, not just one. 

Read the full blog entry for more details about practical issues when using spatial RD techniques. 

Go off and search for those jumps! jumps! :) 

Sunday, July 26, 2020

Easiest to Implement Most Useful Advice Ever

I read a paper "one last time" last week before sending it to a journal. I found and fixed a few things but thought it was generally good to go. Then I remembered reading some advice on twitter about how having Word (or some other program) read your paper out loud to you is a better way to catch mistakes. I tried it, and it worked! I found a bunch of missing words that way! How is possible that we miss these things when reading? Did you notice that I missed the word "it"?  

I didn't know Word knew how to read documents aloud, and I especially didn't know it was such an easy way to catch your own mistakes. 

Friday, July 10, 2020

How to Write an Abstract

Allison Luedtke has tweeted about how to write an abstract. The basic idea: Instead of sitting down to write "the abstract of your paper"----ie, the most important part, the only thing that most people will read, the culmination of years and years hard work----you just sit down to answer four simple question. Much, much better right? 

Question 1: What is the big picture motivation? 
Question 2: What do you do? 
Question 3: What do you find?
Question 4: What do we know now that we didn’t know before?


See the twitter thread for more details, but if you just answer the questions as quickly and simply as you can without trying to make it sound fancy, you'll probably make a lot of progress. The important bit: Abstracts get rewritten a ga-zillion times, so don't worry at all about writing your first one. It will be rewritten anyway. You can probably answer those four questions lots of different ways. Write them all down, maybe in a notebook vs. in the paper itself. See which sounds most compelling. 

P.S.

Yes, I wrote this tweet with job market paper writers in mind, but if there are any second or third years out there, you can start practicing now! Yes, you may not be ready to write your actual abstract just yet. My advice to prepare: when you read papers for your field courses, see if you can answer those four questions from reading just the abstracts. The more practice you have with going from abstract to answering those questions, the easier it will be for you to go from the answers to the questions to the abstract when it comes time for you to do this for your own work. 

Saturday, July 4, 2020

Stata Tip: How to Make a Specification Curve

We know. You have run many regressions and you want to show us how robust your results are. Or maybe you want to show us which control variables make a difference and which ones. Or maybe you want to show us what happens to your coefficients when you use many, many different samples. Sure you can include a gazillion different tables of regressions results, but you can also just show us one picture that tells us everything we need to know. What is that picture? A specification curve! You can see an example below and you can easily make one with the Stata command, speccurve
Demo
Thank you, Hans, for sharing this! 

Monday, June 29, 2020

How to Properly Cite Data

I am a big, big fan of writing papers so that readers can exactly replicate results. One important part of this is telling readers exactly how to get your original data sources. Properly citing data sources certainly helps in this regard, but I think it's also a nice way to reward authors and other organizations for making the data available to researchers. 

One issue in particular I have come across lately is how to cite data that authors have very generously made available on their personal websites or journal websites (I'm thinking of you, David Dorn!). Worry no longer because you can find detailed guidance on how to cite data right here. Note specifically how to cite replication data. Super useful! 

Is the Paper Ready to be Submitted to a Journal?

You may have noticed I haven't posted in a while. The reason: I've been trying to put those last finishing touches on a paper before submitting. It's taking a lot longer than I would have liked. For those of you out there who may be in similar situations, see this twitter thread by Brian Knight for some insights.

Thursday, June 11, 2020

Stata Tip: Multiple Commands Available for Multiple Hypothesis Testing

Yesterday, I attended a (zoom) seminar where multiple hypothesis testing was taken very seriously---you can watch it here if you're interested. I decided I needed to think more about this and, luckily for me, David Mackenzie had already thought very carefully about and blogged about it recently. He evaluates many different Stata commands including the one I heard about in the talk yesterday. 

But the most eye-opening thing was this simple calculation that I admit (shamefully) I had never thought about before. Let's say you examine the impact of four different treatments, and you look at four different outcomes. Not crazy numbers, right? David writes, 

Suppose that none of the treatments have any effect on any outcome (all null hypotheses are true), and that the outcomes are independent. Then if we just test the hypotheses one by one, then the probability that of one or more false rejections when using a critical value of 0.05 is 1-0.95^20 = 64%. 

64%! That's quite a high probability, right?! Wouldn't it be crazy to then write an entire paper on that one result? The multiple hypothesis testing adjustments provide methods to adjust for the fact that we are testing multiple hypotheses. 

Thank you to all of the authors of the Stata commands. You have made it easier for all of us to make the right adjustments, and of course, thank you to David for helping us think about these issues. 


Tuesday, June 2, 2020

Cool Data Alert: COVID-19 Data

I have blogged before about whether you should drop everything and write that COVID-19 paper. If you do decide that, for you, the answer is yes, then check out Stata's resources on how to download and import COVID-19 data to your computer. What an amazing time to be a researcher! 


Updated (6/3/20): Check out how existing longitudinal data sets are incorporating people's experiences with the pandemic. You can sign up for a webinar here

Friday, May 22, 2020

Cool Data Alert: International Education and High-Skilled Immigration in the US

How did people get any research done at all before the internet? Thank you, Mingyu Chen, for putting this together. I can't wait to read about your work! And now I feel like getting back to studying international students. 

Wednesday, May 20, 2020

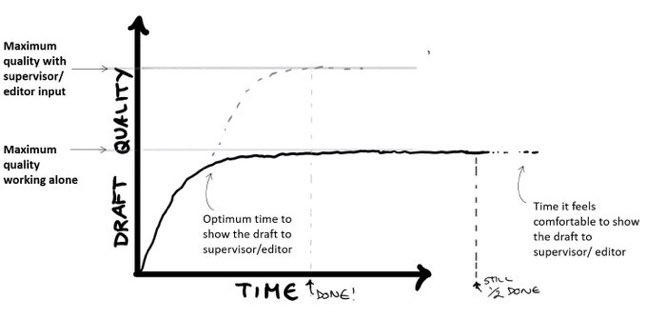
Should You Show Your Advisor Your Current Draft of Your Paper?

Yes, it's a question. Should you send that draft now..or maybe better to try that one thing? And maybe that other thing? Well, Dr. Elinor Hortle tweeted a nice graph with the answer:


Image
I would add: maybe read it once before sending it. Fix obvious mistakes and typos. But then send it! right now! 

And for those of you going on the job market, see this post from last May. I can't say that I'm as excited about May this year, but the main message is the same: don't ignore your advisor. ;) 

Sunday, May 17, 2020

How Many Clusters? This Flow Chart Tells You What to Do

Yeah, in general I waste way too much time on twitter. But tweets like this one make it all worthwhile! Patrick Button shows us exactly the inference issues AND what to do about depending on how many clusters we have. Be sure to bookmark this page for future reference. And Patrick, I hope to meet you in person someday just so that I can thank you in person. 


Image
Handy Dandy Flow Chart About Clustering and Inference

Thursday, April 30, 2020

What We Can Learn from the Search for a Coronavirus Vaccine

I've blogged about this before. I'll probably blog about it again. Sometimes you have an excellent idea and you've gotten the data and you've done everything right, but..things just don't work out. Maybe the standard errors are too large, the sample is too small, results are not at all robust, estimate sizes are too big to be believable and the wrong sign! The ways in which "failure" can manifest itself in empirical research are endless. :)  


But today, I wanted to point to a particularly exciting possibility: Your failure today may be the very thing that generates tremendous success in the future! 

How did I come up with this crazy thought? Have a look at this article on the race for a coronavirus vaccine and the research group winning the race right now. I loved reading this article, mostly because at least it was some bit of hopeful news about this pandemic. But what stood out most to me were these lines: 

The Jenner Institute’s coronavirus efforts grew out of Professor Hill’s so-far unsuccessful pursuit of a vaccine against a different scourge, malaria.

It’s so funny that in FAILING to find a vaccine for malaria, he was inadvertently SUCCEEDING (in getting closer) to finding a vaccine for a virus nobody knew about!!! 

The same thing can happen to you. When any of the disasters listed above happen to you--trust me, they will happen if you stick to doing research--learn what you can from the experience. You may not get the "top 5" for that particular idea with those particular data, but what you learned in the process may just...save the world...sometime in the future. 

While reading all of these articles on the quest for COVID-19 treatments, it occurred to me that so many researchers all over the world are working really, really hard right now but will ultimately not be the ones to find that vaccine or cure. I am so grateful for the doctors, nurses, cleaners, grocery store workers, delivery workers. And of course I will absolutely be grateful for the scientists who ultimately find the successful vaccines and drugs. But today, I wanted to send out a particular thank you to all of the research groups who are trying!  Trying despite knowing that the chances of success are pretty low ("less than 10 percent of drugs that enter clinical trials are ever approved by the Food and Drug Administration"). A toast to you! A toast to all of the readers of this blog who keep trying to learn about the world, despite failure after failure, hoping to make the world a little (or a lot) better.

three clear beakers placed on tabletop

Thursday, April 23, 2020

Should You Stop Everything and Write that COVID-19 Paper Right Now?

There is so much the world needs to know about COVID-19 right now. The more and the sooner we learn about it, the better. If any of you out there reading this blog are considering working on a cure for the disease or a vaccine or something that may help all of us deal with the economic ramifications of social distancing (and you are capable of doing this research because you're healthy and your children are taken care of, etc.), then my answer is YES! We need you! 

But what about those of us who are not exactly in that position? This open letter for social scientists written by Damon Philips provides excellent guidance. 

My favorite parts: 

We are immersed in a century-defining moment....today, the world is not what it seems, but we still have a need to understand it, and through it to understand ourselves. You wouldn’t be a PhD student if you didn’t already feel this at some level. My point: I believe we are on the precipice of transformational research.

How is that for some inspiration!

But he also writes that we do not need to pursue new topics "in this immediate moment". Instead, he suggests that we "keep thinking about what's going on, constantly interrogating with the conceptual, methodological, and empirical tools we currently have". It is hard to come up with good ideas in general. It is probably especially hard when we're dealing with crushing anxiety from the pandemic. But, if we keep our minds open, this experience may generate quite an amazing post-dissertation topic, or post-tenure topic, or even a topic that a future PhD student will develop. 

I do hope that what we learn from this experience will allow to make the world a better place. Eventually. 

Friday, April 17, 2020

Nick Hagerty's Reflections on Grad School in Economics

Nick Hagerty has put together an excellent set of slides with advice he'd give his younger self. You can download the slides here. Yes, I have blogged about many of these things before, but I think it is worthwhile for students to read these things again and again..in fact, mid-career associate professors can also use some reminding of these things every now and then. 

For students: I really like the advice of going to talk to your advisors, even when you have nothing to show them. Maybe you can talk to them (even for 5 minutes) about why you have nothing to show them. Maybe they can help you, maybe they can't. But it's absolutely true that advisors wonder (worry?) about you when they haven't seen you in a while. 

I also really like the insight of not being able to predict the research frontier. It moves way too fast! Best to just work on something that interests you. 

I'm not sure what I think about the advice of not worrying about grades. On the one hand, I absolutely agree that, all else equal, they don't matter. Summer RAships matter a lot more, for example. But I professors have some choice over who they hire, and with limited information, they are likely to prefer students who have done better in their classes. Before hiring a student who they don't know, they will ask colleagues for insider information. Conclusion: I wouldn't completely blow off classes. 

And for the mid-career professors reading this blog, the last slide is for you! It's about the achievement/status game. For easy reference, I'll copy-paste the important bits here: 

You’ve probably been playing it for a long time. When does it end? 
- Never. 
- Jobs, publications, tenure, promotion, keynote addresses, prizes... 
- It can be hard to ever feel like you “made it” because by the time you get there, you’ve already raised the bar for yourself and are now comparing yourself against an even more elite group of people

You get to choose when you cash in! 
- Other careers will pay you more to work on things you’re not excited about 
- If you want to stay, keep playing the game at least a little bit 
- But make sure you enjoy things along the way

Thursday, April 9, 2020

"The secret to good writing is good editing."

What an excellent first sentence, of this NYTimes article on how to edit your own writing. 

Simple great advice: “Never use a long word when a short one will do.” (From George Orwell's book, “Politics and the English Language”) 

What I'm probably most guilty of: "When you’re not quite sure what you want to say, it’s easy to ramble around a point, phrasing it in three or four different ways and then, instead of cutting them down to a single concise sentence, slapping all four together into a clunky, unclear paragraph."

Something I hadn't thought of but it makes sense: "The longer you can leave a draft before editing it, the better." That's probably why I catch so many mistakes in manuscripts when rereading a paper (that has already been submitted and so should be perfect) just before giving a seminar. Time has passed. 

Another good one: "If a word isn’t necessary in a sentence, cut it; if a sentence isn’t necessary in a paragraph, cut it; and if a paragraph isn’t necessary, cut it, too." Your readers will be grateful! 

There are more tips in the article. Definitely a good read. And yes, I reread this post before posting it.

Sunday, April 5, 2020

Research Productivity During a Pandemic

You might have noticed that I haven't posted anything in a while. You may also have figured out that March wasn't an easy month for me--I don't think it was for anyone. Things aren't looking that great for April either. I wish I had some tips for you on how to stay productive during a crisis. I absolutely have no idea how to do that. The only good news I have read lately is that maybe a crisis is not the time to be productive. 

This article explains: "It is perfectly normal and appropriate to feel bad and lost during this initial transition. Consider it a good thing that you are not in denial, and that you are allowing yourself to work through the anxiety." 

These words brought comfort: "Know that you are not failing."

And these brought hope: "Some faculty members are feeling distracted and guilty for not being able to write enough or teach online courses properly. Others are using their time at home to write and report a burst of research productivity. All of that is noise — denial and delusion. And right now, denial only serves to delay the essential process of acceptance, which will allow us to reimagine ourselves in this new reality.

On the other side of this journey of acceptance are hope and resilience. We will know that we can do this, even if our struggles continue for years. We will be creative and responsive, and will find light in all the nooks and crannies. We will learn new recipes and make unusual friends. We will have projects we cannot imagine today, and will inspire students we have not yet met. And we will help each other. No matter what happens next, together, we will be blessed and ready to serve."

For more insights on mental health during a crisis, see these videos put together by the BU School of Public Health. 

Hang in there people! If you are able to productive, to give great online classes, to provide insights on twitter or in academic papers of how best to handle Covid-19, to submit papers to the QJE, etc., thank you (ooo, an extra thank you to my coauthors who are able to work on my papers!). We need your work more than ever. But if you can't do it just yet, I think that's OK for now. The truth is that the pandemic will end. Things will get back to normal. But other crises will come, and the more tools we develop to best navigate them, to get through them, the more productive we will be in the long run. 

Take care of yourselves, and if you need help, do reach out. 

For UConn student students needing help, please refer to UConn’s Mental Health Services at counseling.uconn.edu. Students can call 860-486-4705 to make an appointment for a tele-mental health visit with a provider.

Thursday, February 27, 2020

Getting Your Work Published

Frederic Vermeulen explains the process given his experience as editor at Economic Journal. Watch the entire video. Very useful tips for graduate students just starting. 

Tuesday, February 25, 2020

An Introduction to RD Design

John Holbein has very generously shared some slides he put together on regression discontinuity design. They are not only entertaining, but also very informative and helpful. I love all of the examples. My thoughts: The more examples of RDDs you see and think about, the more likely it is that you will develop a great idea for a paper using a discontinuity.  

Saturday, February 8, 2020

How to Choose a PhD Advisor

Here it is: a quite excellent guide. Not only does it describe the relevant information, but it also explains how to get this information.


Friday, February 7, 2020

Stata Tip: Making Maps in Stata

Click here to see detailed instructions on coder's corner.

In case the link ever stops working, do a search for the Stata command spmap.

H/T: David McKenzie.

Thursday, February 6, 2020

The Best Description of What It's Like To Write I Have Ever Seen

I have been reading Angela Duckworth's book, Grit. Definitely worth a read especially when you're in a slump. My favorite part of the book comes at the end where she writes down words spoken by Ta-Nehisi Cates on the process of writing. So powerful. So true. 

The challenge of writing
Is to see your horribleness on page.
To see you terribleness
And then to go to bed.

And wake up the next day,
And take that horribleness and that terribleness,
And refine it,
And make it not so terrible and not so horrible.
And then to go to bed again.

And come the next day,
And refine it a little bit more,
And make it not so bad.
And then to go to bed the next day.

And do it again,
And make it maybe average.
And then one more time,
If you're lucky,
Maybe you get to good.

And if you've done that,
That's a success.


Friday, January 31, 2020

Handy Dandy Checklist for Those Doing RD

I just found this handy dandy checklist from the Department of Labor for those of your working with regression discontinuity designs. Be sure to check the list before submitting your third year papers or sending a paper to a journal. Actually, I think it's a handy list for referees at journals to use, too! Especially referees who themselves do not have a lot of experience with RD design.

Thursday, January 30, 2020

Stata Tip: How to Make Your Graphs Look Nice

Tal Gross tweeted some really nice, easy tips on how to make your Stata graphs look just a little bit nicer than the default graphs.

Tip #1: Use labels instead of legends. They look so much more professional!
Tip #2: Make all text horizontal (I guess I don't feel so strongly about this one).
Tip #3: Get rid of unnecessary ink. Yes, this does make the graph look like you took just a little bit of time to make the graph your own.

The best part: Stata code is included in the thread. Go ahead and copy-paste his code into your code.

Stata Tip: Create a String Variable from a Numerical Variable's Labels

Maybe I should have known about this command. Maybe I did know it at some point in my life. Either way I re-discovered it recently so I thought I'd share it. 

Here's the situation. Imagine you're using one data set with a variable called, let's say "country of birth," with numeric codes for the different countries and then labels with the  names of the actual countries. Now let's say that you want to merge GDP data for these countries but that other data set lists countries by name, not numerical code. How do you quickly create a new variable in the original data set with the name of the country? Easy! Just use the decode command in Stata! You're welcome. 

Monday, January 13, 2020

Mastering Mostly Harmless Econometrics: 2020 AEA Continuing Education Webcasts

Dear PhD students who have finished the core courses and are about to get started on field courses, 

Please watch these videos very carefully. Pay attention. Take good notes. If you are considering a field in applied micro, then be sure to read this book and this one, too. If you took good courses as an undergrad on modern empirical techniques, then maybe you can watch the videos at 2x speed--which is actually kind of funny. But watch the videos. 

Sincerely,
Delia

P.S.
This is especially true for any students who are considering working with me in the future!


How to be a Good Seminar Participant

Berk Özler has some great advice on how to behave at seminars. My favorite is probably this one:

 Allow presenters time at the beginning to frame their talk without interruption. 

I don't think anyone has to be looking at their watches to see if it is exactly 10 minutes into the seminar, but let the presenter get through the introductory slides before asking an introductory question. And yes, I know you have some concerns about the identification strategy and you are eager to share them, but please, please, let the presenter explain the question and the identification strategy before voicing these concerns. Yes, you know this literature and maybe you read the paper, but it confuses everyone in attendance if we're discussing problems with the technique before knowing what the technique is. Just wait a few minutes. You are encouraged to ask those questions right after the baseline results. 

There is only piece of advice that I would tweak a bit. The post mentions a concern that men ask a lot more questions than women, and a solution to this is for men to "think twice before asking a question (“does it really need to be asked?” “is the answer coming up in a few slides?” “is it better to ask this when I meet the speaker later in the afternoon?”)." I would say that seminars would run more smoothly if everyone asked themselves these questions before asking a question. 

All of that said, I want to stress that I really enjoy lively seminars--both as a participant and as a presenter. I do not think the world would be a better place if only one or two perfectly though out questions were asked in seminars. I am just afraid that we sometimes spend too much time asking unnecessary questions at the beginning--perhaps throwing off the speaker--and we don't have enough time to ask the really juicy questions at the end. And that is a pity. 

From PhDcomics: