Arindrajit Dube (@arindube) just tweeted code for plotting regression coefficients with confidence intervals. As if that were not enough, he also plots the different categories of coefficients in different colors with labels for the categories! So helpful! Click here for the twitter thread.
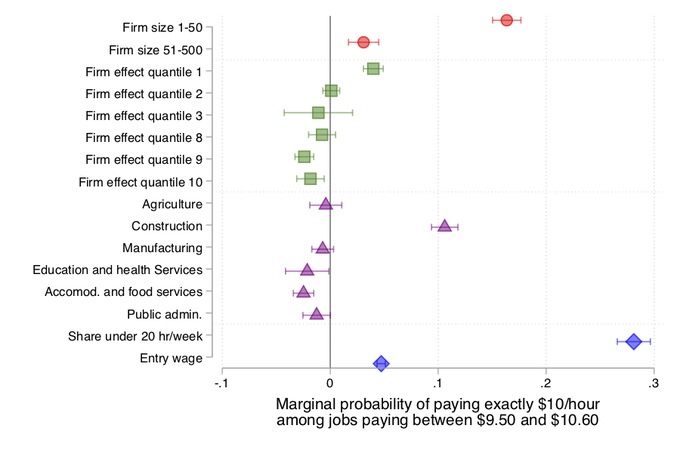
This is what the code produces in the end:
No comments:
Post a Comment