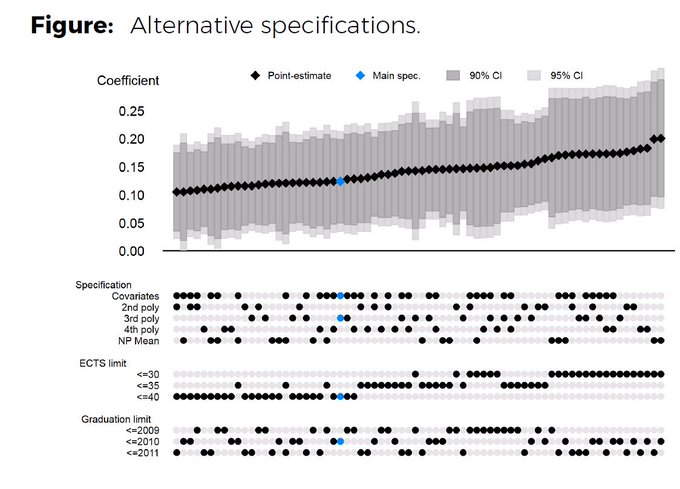
There are so many little decisions we have to make when doing applied micro search. How should we measure our variables of interest? Which sample should be our baseline sample? Which variables should we control for--beyond the obviously important ones? The answer (hopefully) to many of these questions is "it probably doesn't matter so much". If that's the case, then ideally, we'd show our readers that it really doesn't matter. This is great in theory but if there are that many mini-decisions to make, how can we show all of this in 30 page paper? Hans Sievertsen (@hhsievertsen) recently gave us the answer in a tweet. The graph looks amazing. So much information! And he even provides the code he used to make the beautiful picture.

No comments:
Post a Comment